NEW YORK (CNNfn) - You could forgive the people at Sysco Inc. for envying the folks at Cisco Systems.
Sysco delivers food, not the sexiest of industries. Cisco makes the routers and switches that speed information delivery. Cisco's CEO gets flashy magazine profiles. Sysco's chief doesn't. Cisco shares catapulted more 100 percent last year. Sysco shares didn't.
But Sysco investors just found reason to cheer. Since the end of March, stock in the nation's biggest food distributor is up 8 percent. Shares of� Cisco, a kind of proxy for the Internet's growth, are down 15 percent in the period.
What gives? Credit Sysco's out-performance with the growing allure of value stocks.
Investors fleeing a deflating tech bubble that began leaking in March have snapped up long-ignored companies with predictable earnings such as Houston-based Sysco. Beaten-up value investors who waited years for the markets to become "rational" and reward stable profits at cheap prices, are getting some rewards.
But is the strength of value stocks temporary or permanent? Depends on who you ask.
Bargain hunting
Not surprisingly, value investors expect recent gains to continue. They point to the cyclicality of investing strategies. The success of growth investing, where investors chase companies with faster-than-average earnings momentum at any price, often comes at the expense of the value strategy -- and vice versa. In the late 90s growth trounced value.
"I think the change we've seen is a sea change and it will be a several-year change versus several weeks," said Alan Snyder, president of Snyder Capital Management, which manages $2 billion for large institutions.
Value investors could use a change. Through June 30, large capitalization growth mutual funds posted an average three-year annualized return of 27 percent, according to fund tracker Morningstar. Large company value funds delivered 8.74 percent in the period.
But in the second quarter of 2000, value funds outperformed growth by more than 2 percentage points, Morningstar said. Citing historical precedent alone, value managers see the second quarter as the start of something good.
"I think the catalyst is there for it to be sustained," said Tom Putnam, who heads Fennimore Asset Management and co-manages the $330 million FAM Value Fund.�
But Mark Klee, who runs the $2.8 billion John Hancock Technology Fund, disagrees.
Not that he expects the Nasdaq composite index to surge 86 percent this year like it did in 1999. But Klee doubts that companies in the value category can raise prices enough to show the kind of earnings growth he believes investors will continue to reward.
"I don't think value is ready to take the mantle of leadership," Klee said. "I think other than short-term moves, the environment is still far superior for those companies that provide strong earnings gains."
Still, no one disagrees that the market's most speculative, frothy days are over. Sentiment has changed markedly from late 1999, when a little-known company, VA Linux (LNUX: Research, Estimates), jumped over 700 percent in its first day of trading.
The initial public offering market for technology companies has slowed in recent months as investors show unwillingness to bid new stocks to stratospheric levels. AT&T Wireless (AWE: Research, Estimates), a record $10.6 billion IPO launched in April, now trades well below its offering price of $29.50.
At the same time, acquisition-hungry firms are buying long-ignored companies, validating their worth. Philip Morris �(MO: Research, Estimates) last month said it was snapping up Nabisco Holdings Group (NGH: Research, Estimates). Times Mirror� �(TMC: Research, Estimates)� received a generous takeover offer from Tribune (TRB: Research, Estimates) in March. United Airlines' parent UAL Corp. (UAL: Research, Estimates) announced in May it is buying struggling US Airways (U: Research, Estimates).
What price growth?
For growth stocks, it's been a great run. Three of the four most valuable companies, Intel (INTC: Research, Estimates), Cisco (CSCO: Research, Estimates) and Microsoft (MSFT: Research, Estimates), are technology firms. Still, General Electric �(GE: Research, Estimates) recently regained the No. 1 spot that has at times been held by Microsoft and Cisco -- two companies that aren't old enough to drink.
Looking ahead, David Powers, senior technology analyst at Edward Jones, expects the Nasdaq to trade in the 4,000 to 4,400 range through year's end, putting it just barely higher for 2000.
"My view is we continue to trade in a sideways pattern for the rest of the year," Powers said.
With technology stocks still trading a historically high prices, Powers believes there's little room for any of the earnings of disappointments that will inevitably come.
Just ask Computer Associates (CA: Research, Estimates). Investors shaved the software provider's market value almost in half earlier this month after the company warned it wouldn't meet earnings forecasts.
Powers said that if the Federal Reserve, which has raised interest rates six times since June 1999, is successful in slowing the economy, demand for technology products will slow.
No wonder he has a "hold" rating on Cisco stock.
Sifting among the downtrodden
When it comes to individual value stocks, Fennimore's Putnam likes New England Business Services (NEB: Research, Estimates), which makes printed business products such as checks and business forms.
Trading at just eight times earnings, the company has a 10 percent to 12 percent growth rate, Putnam said.
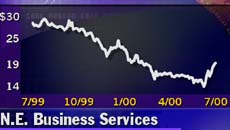 �"We just think it's a very well-managed company," he said. �"We just think it's a very well-managed company," he said.
Snyder, of Snyder Asset Management, meanwhile, is betting on
Sea Containers (SCR.A: Research, Estimates), the Bermuda-based cargo ship supplier and hotel operator with a thrifty P/E ratio of nine.
By those standards, Sysco looks downright expensive. With a $39 share price and 2000 earnings forecast of $1.33 per share, the food distributor has a P/E ratio of about 31.
Value, it seems, is in the eye of the beholder. 
|
