|
P&G profit woes continue
|
 |
August 1, 2000: 9:42 a.m. ET
Consumer products maker meets lowered 4Q estimates; warns on 1Q
|
NEW YORK (CNNfn) - Consumer products maker Procter & Gamble, struggling with sluggish sales and a costly restructuring effort, reported a 3 percent drop in fiscal fourth-quarter earnings Tuesday and warned that its profit will remain weak in the near term before picking up next spring.
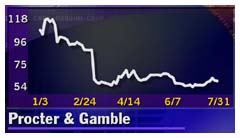
The Cincinnati-based maker of Pampers diapers and Tide laundry detergent is reeling from a series of earnings disappointments this year, as well as a management shakeup that led to the ouster of former CEO Durk Jager in June. The 162-year-old company, a component of the Dow Jones industrial average, has traditionally been one of Wall Street's stalwarts, but its earnings woes have sent its stock plummeting.
 P&G told industry analysts that the company is undergoing a major effort to refocus on its core brands and customers, while still continuing the controversial Organization 2005 restructuring effort. The $1.9 billion plan is designed to drive up profitability by slashing thousands of jobs and spending heavily to develop new products. P&G told industry analysts that the company is undergoing a major effort to refocus on its core brands and customers, while still continuing the controversial Organization 2005 restructuring effort. The $1.9 billion plan is designed to drive up profitability by slashing thousands of jobs and spending heavily to develop new products.
But company officials admitted that their aggressive spending on the reorganization came at a bad time. Over the past year, financial results have been hit by higher raw materials, the negative impact of foreign exchange rates and more competition.
"The issue for P&G is balance," Chief Executive A.G. Lafley said in a conference call with industry analysts. "We simply have to get the balance back."
P&G shares slipped in early trading, but then bounced up 13/16 to 57-13/16 at midday. The beaten-down stock is down nearly 50 percent this year.
 P&G's net income fell to $777 million, or 55 cents a share, before one-time charges, for the fourth quarter ended June 30. Year-earlier profit totaled $799 million, or 55 cents per share, excluding special items. The latest results matched the reduced estimates of analysts polled by earnings tracker First Call. P&G's net income fell to $777 million, or 55 cents a share, before one-time charges, for the fourth quarter ended June 30. Year-earlier profit totaled $799 million, or 55 cents per share, excluding special items. The latest results matched the reduced estimates of analysts polled by earnings tracker First Call.
Including a $261 million after-tax charge related to the Organization 2005 restructuring, net income for the latest period slid to $516 million, or 36 cents per share.
Quarterly revenue rose a slim 2 percent to $9.66 billion from $9.3 billion in the year-earlier quarter. The impact of currency translations reduced sales by 1 percent.
 The company said it is on track to meet Wall Street's earnings forecasts for fiscal 2001, but said that short-term results would be lower than expected. Industry analysts anticipate the company will post earnings of $3.24 per share for fiscal 2001. The company said it is on track to meet Wall Street's earnings forecasts for fiscal 2001, but said that short-term results would be lower than expected. Industry analysts anticipate the company will post earnings of $3.24 per share for fiscal 2001.
For the fiscal first-quarter ended in September, results are expected to be flat, compared with year-earlier earnings of 88 cents per share. Wall Street has been expecting first-quarter earnings of 92 cents per share.
To compensate for the lower-than-expected first quarter, P&G said its earnings will grow in the mid-single-digit range during its fiscal second quarter and then return to double-digit growth rates during the second half of the year.
For the full year, P&G earned $4.23 billion, or $2.95 per diluted share, before one time items, up slightly from the $3.78 billion, or $2.56 a share, a year earlier. Revenue rose 5 percent to $39.95 billion. 
|
|
|
|
|
|
Procter & Gamble
|
Note: Pages will open in a new browser window
External sites are not endorsed by CNNmoney
|
|
|
|
 |

|

