NEW YORK (CNNfn) - Treasury bonds posted solid gains Thursday, lifted by a favorable economic report on the non-manufacturing sector one day ahead of key employment data.
In the currency markets, the dollar rose sharply against the euro but fell against the yen.
Shortly before 3 p.m. ET, the benchmark 10-year Treasury note rose 6/32 of a point in price to 103-29/32. Its yield fell to 5.95 percent from 5.97 percent Wednesday, as yields move inversely to price.
The 30-year bond gained 14/32 to 107-9/32, its yield retreating to 5.73 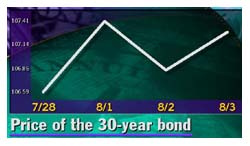 percent from 5.76 percent. percent from 5.76 percent.
Treasury prices initially moved higher in response to a sharp drop among U.S. equities. Investors often reallocate money into the relative safety of government securities when stocks decline sharply.
However, the market held onto gains despite stocks paring those losses.
Analysts said favorable economic news contributed to strength.
The National Association of Purchasing Management (NAPM) non-manufacturing index, a measure of non-manufacturing activity, fell to 55.5  in July from 64 in June. Although the index is not as closely watched as its counterpart, the NAPM survey of manufacturing activity, analysts said the drop was significant. in July from 64 in June. Although the index is not as closely watched as its counterpart, the NAPM survey of manufacturing activity, analysts said the drop was significant.
Ian Shepherdson, chief U.S. economist at High Frequency Economics, wrote in a note to clients the non-manufacturing NAPM report might be a sign that the Federal Reserve's tightening campaign is beginning to have an impact outside the manufacturing sector.
"The friendly data such as the decline in the NAPM non-manufacturing added support," said Bill Sullivan, senior economist at Morgan Stanley Dean Witter.
In order to cool the economy and contain inflation, the central bank has raised short-term interest rates six times since June 1999. The next policy meeting is scheduled Aug. 22.
Action from the Fed and technical factors also helped Treasurys. The central bank bought securities with maturities between Aug. 15, 2020 to Nov. 15, 2028, in a process known as a coupon pass. Coupon passes support prices by reducing supply.
The yield on the 10-year note broke below a key technical level at 5.97 percent.
Awaiting jobs data
Investors appear less fearful of the much-anticipated July employment report, slated for release Friday morning.
Analysts polled by Briefing.com forecast payrolls to have risen to 70,000 in July compared to a gain of 11,000 in June, and the unemployment rate to hold steady at 4 percent.
Michelle Girard, strategist at Prudential Securities, told CNNfn's Before Hours the unemployment rate may be the most important element to the report. (293K WAV) (293K AIFF)
Other economic news was largely discounted. Factory orders jumped 5.5 percent in June compared to a revised 4.7 percent gain in May, the Commerce Department said Thursday.
U.S. jobless claims rose 2,000 to 276,000 in the week ended July 29.
Dollar soars vs. euro
The dollar set a new 10-week high against the euro Thursday as the favorable outlook for U.S. interest rates, relative to those in the euro zone and Britain, continued to boost the U.S. currency.
Analysts said the decision by the European Central Bank (ECB) and the 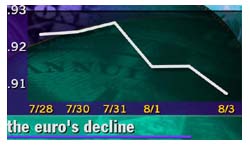 Bank of England to keep their interest rates unchanged Thursday, in line with expectations, reinforced positive sentiment for the dollar. Bank of England to keep their interest rates unchanged Thursday, in line with expectations, reinforced positive sentiment for the dollar.
Shortly before 3 p.m. ET, the euro was trading at 90.74 cents, down from 91.50 cents Wednesday, a 0.8 percent gain in the dollar's value. The dollar was at 108.41 yen, down from 108.82 yen Wednesday. 
|
