|
Is Yahoo! overvalued?
|
 |
August 17, 2000: 5:17 p.m. ET
Prudential analyst says Web portal's current valuation is high
|
NEW YORK (CNNfn) - It's no secret that Yahoo! is a well-managed, highly profitable and ultra rapidly growing Web portal that has left its competitors in the dust.
However, there is a difference between a good company and a good stock. Even a rapidly growing company has to be priced at the right level to be an attractive investment. At the end of the day, a stock should be worth the present value of its expected future cash flows. Since one can't eat a stock certificate or live underneath it, there is no other reason to own a security over the long run aside from receiving the value of those future earnings.
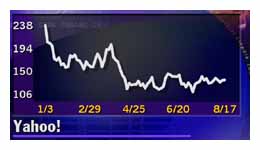
While almost all of the analysts who follow Yahoo! �(YHOO: Research, Estimates) are very bullish about its future prospects, some are questioning its current stock price. At a price of 132, Yahoo! is about half its 52-week high of 250. However, even at that reduced price, the company still sells for more than 280 times what analysts expect it to earn in 2000 and 228 times expected earnings for 2001.
The most recent criticism of Yahoo!'s lofty valuation comes from Prudential analyst Mark Rowen, who initiated coverage of the Web portal on Thursday. While he gave the stock an "accumulate" rating and price target of $155 a share, he also indicated that its sky-high valuation may cause investors to pause.
"While we believe that investors will see good future returns, Yahoo!'s lofty market valuation makes it unlikely, in our opinion, that investors will reap the outsized returns they have come to expect," Rowen said in a research note issued Thursday.
To justify its current stock price, Yahoo!'s future market capitalization needs to increase to $378 billion in 2010, assuming a 20 percent annual return to shareholders, he wrote. To hit that market value, Rowen estimates that Yahoo! needs to achieve more than $30 billion in net revenue, $9.6 billion in net income and trade at 40 times earnings in 2010.
 Rowen then compared this valuation scenario to the current 50 largest public companies and found that only three have a firm value of more than $378 billion -- even Microsoft did not make the cut -- and only 14 public companies have a value of more than $200 billion. Rowen then compared this valuation scenario to the current 50 largest public companies and found that only three have a firm value of more than $378 billion -- even Microsoft did not make the cut -- and only 14 public companies have a value of more than $200 billion.
"Therefore, if Yahoo! shares are to provide investors with significant upside potential, then we believe it will have to become one of the most highly valued companies in the world," Rowen said.
To be sure, Yahoo!'s growth has outpaced almost every other publicly traded company in the past decade. Starting with just $84 million in revenue in 1997, Yahoo!'s sales rose to $588.6 million last year and are on target to hit about $1.1 billion this year.
"[Yahoo] is well run, extremely profitable, and its awesome business model stands head and shoulders above most Internet companies," Rowen said. "That's the good news. The bad news is that most investors already know these facts and in our view they are priced into Yahoo!'s market valuation."
While Yahoo!'s management has stated that its revenue growth is increasingly dependent on factors other than page-view growth, Rowen's analysis found that there is a 98.5 percent correlation between advertising revenue and page views served.
Lehman Brothers analyst Holly Becker had similar views of Yahoo!'s stock in a research report issued on July 12, right after the company reported its quarterly earnings.
"An extremely high valuation, in the face of an increasingly challenging online advertising environment, keeps us 'neutral' on the stock," Becker wrote. Among Wall Street securities analysts, "neutral" is often a euphemism for "sell," because analysts generally try to avoid offending the companies they cover and interfering with their employers' investment banking relationships.
In afternoon trading Thursday, Yahoo! shares fell 7/8 to 133-1/8. 
|
|
|
|
|
|
Yahoo!
|
Note: Pages will open in a new browser window
External sites are not endorsed by CNNmoney
|
|
|
|
 |

|