|
Durable goods orders sink
|
 |
August 24, 2000: 9:10 a.m. ET
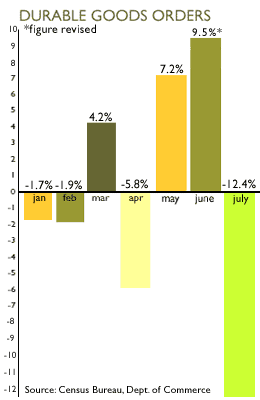
Record 12.4% July decline is more than twice what analysts expected
|
NEW YORK (CNNfn) - Orders for aircraft, refrigerators and other durable goods fell 12.4 percent in July, the biggest drop on record in the United States, the government reported Thursday, and a much bigger decline than Wall Street economists had forecast.
New orders for durable goods, items meant to last at least three years, fell $30 billion to $212.4 billion last month, the Commerce Department report said. The slide follows a revised 9.5 percent gain posted in June. Analysts surveyed by Briefing.com had forecast a 6 percent drop in July.
 While economists emphasized that the report contains volatile, preliminary figures that are affected by unique events in different segments of the economy, they said there does appear to be signs of a slow-down in manufacturing in the report. While economists emphasized that the report contains volatile, preliminary figures that are affected by unique events in different segments of the economy, they said there does appear to be signs of a slow-down in manufacturing in the report.
"This report may modestly lower third-quarter real GDP estimates," First Union chief economist David Orr said.
He said the best measure of the overall economy contained in the report, non-defense capital goods orders excluding aircraft, managed a 0.2 percent rise, and that including modest gains in August and September should come in with a 13 percent annual growth rate.
"Not bad, but less than the 18 percent (annual rate of growth) in the second quarter and 26 percent (rate) in the first quarter," Orr said.
Still, the report shows new orders are up almost 3 percent from April. Melanie Hardy, economist with Bear Stearns, said the monthly data are too volatile to use to draw too many conclusions. She said much of the drop was due to a fall in orders for aircraft.
"I don't think this will make much of a difference," Hardy said. "If we see another number like this in August data, that might be a concern. But you need to look at more than month-to-month changes to sift through the volatility."
Orders for new transportation equipment fell almost a third to $46.8 billion from $68.5 million in July. That accounted for about two-thirds of the total drop. Still, even excluding transportation goods, durable goods orders fell a steeper-than-expected 4.8 percent in July, compared with a revised 0.5 percent rise posted in June.
Defense orders fell more sharply, tumbling 72.0 percent, while non-defense orders fell 12.3 percent, the largest drop in that category since December 1997.
Investors often have been cheered by recent reports of a slowing economy, due to the belief such signs would lead the Federal Reserve to stop raising, and perhaps even start reducing, interest rates. U.S. stock markets opened mixed, then climbed slightly higher Thursday, while bond rates were little changed.
Meanwhile, new jobless claims increased for the third straight week to 314,000 last week from a revised 310,000 the prior week, the Labor Department said in a separate report. That topped estimates of 305,000 by analysts surveyed by Briefing.com. A reading of about 300,000 or below points to a tight labor market. 
|
|
|
|
|
 |

|