|
Treasurys tumble
|
 |
August 28, 2000: 3:19 p.m. ET
Stock, oil strength pressure market amid quiet trading; dollar mixed
By Staff Writer Jill Bebar
|
NEW YORK (CNNfn) - Treasury bonds ended sharply lower Monday in a notably quiet session as strength among U.S. stocks and higher oil prices depressed the market.
The dollar fell against the yen but rose slightly against the euro.
Shortly before 3 p.m. ET, the benchmark 10-year Treasury note fell 13/32 of a point in price to 99-25/32. The yield, which moves inversely to price, rose to 5.77 percent from 5.72 percent Friday.
The 30-year bond dropped 27/32 to 107-13/32, its yield rising to 5.72 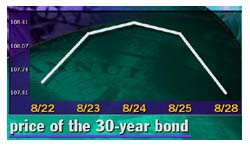 percent from 5.66 percent. percent from 5.66 percent.
A rally among equities drew investors away from Treasurys. In late afternoon trading, all three major U.S. stock indexes posted solid gains.
Strength in stocks can often negatively affect bonds as inventors shift money into equities, which promise higher returns.
Concerns about high oil prices, which raise the prospect for inflation, also weighed. Crude oil futures for October delivery rose 77 cents to $32.80 a barrel on the New York Mercantile Exchange.
Nevertheless, trading volume was thin throughout the day with many participants on vacation. As a result, price movement was exaggerated.�
"It's a very thin market," said Kevin Logan, senior market economist at  Dresdner Kleinwort Benson. "People don't want to take any risk because of the lack of liquidity." Dresdner Kleinwort Benson. "People don't want to take any risk because of the lack of liquidity."
Because Treasurys have rallied so much the past several months, analysts said they are susceptible to bad news. Bill Hornbarger, fixed income strategist at A.G. Edwards, told CNNfn's Before Hours the market has already priced in much of the good news. (245K WAV) (245K AIFF)
With signs of moderating growth, the Federal Reserve kept short-term interest rates steady last week, and many expect it to remain on the sidelines for the remainder of this year.
With the Fed concerned about a tight U.S. labor market, investors were defensive ahead of Friday's key employment report.
Analysts polled by Briefing.com forecast payrolls to have declined 20,000 in August compared to a decline of 180,000 in July, and the unemployment rate to hold steady at 4 percent.
The latest data had little impact. Personal income rose 0.3 percent in July, and personal spending gained 0.6 percent in the same month, the Commerce Department reported. Both numbers were largely in line with expectations.
(Click here for a look at Briefing.com's economic calendar.)
Dollar mixed
Activity in the currency markets was subdued Monday with London closed in observance of a bank holiday. The dollar traded in narrow ranges against the major currencies.
Paul Podolsky, strategist at FleetBoston in Boston, said gains among 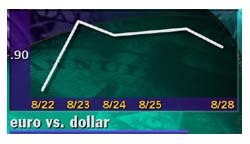 equities bolstered the dollar against the euro as traders await Thursday's European Central Bank policy meeting -- the week's big event. equities bolstered the dollar against the euro as traders await Thursday's European Central Bank policy meeting -- the week's big event.
Shortly before 3 p.m. ET, the euro traded at 90.07 cents, down from 90.24 cents Friday, a 0.2 percent gain in the dollar's value. The dollar was buying� 106.33 yen, down from 106.77 yen Friday. 
|
|
|
|
|
 |

|