|
New home sales jump
|
 |
August 29, 2000: 3:40 p.m. ET
Sales surge 14.7%, biggest jump in more than seven years; confidence dips
By Staff Writer M. Corey Goldman
|
NEW YORK (CNNfn) - Sales of new homes in the United States posted their biggest jump in more than seven years in July, while consumer confidence dipped in August but stayed near record levels, according to reports Tuesday.
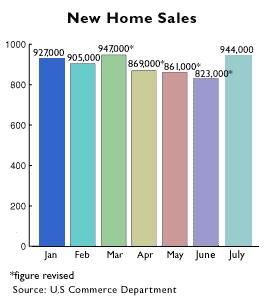 The Commerce Department said the number of new single-family homes sold jumped 14.7 percent to a 944,000-unit annual rate in July, topping June's revised 823,000-unit advance and well above the 840,000-unit pace expected by analysts polled by Briefing.com. The sales gain was the biggest since a 16.4 percent jump in April 1993. The Commerce Department said the number of new single-family homes sold jumped 14.7 percent to a 944,000-unit annual rate in July, topping June's revised 823,000-unit advance and well above the 840,000-unit pace expected by analysts polled by Briefing.com. The sales gain was the biggest since a 16.4 percent jump in April 1993.
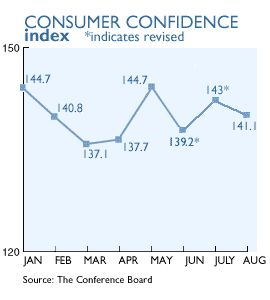
In a separate report, the Conference Board said its gauge of consumer confidence slipped to 141.1 in August from a revised 143 in July. Analysts polled by Briefing.com had expected a reading of 141.5. The gauge hit a record 144.7 in May, matching January's figure. Consumer spending fuels two-thirds of the U.S. economy, so readings on consumer attitudes are closely watched by economists and policy makers.
Together, the numbers offered a mixed snapshot of the economy -- one where consumers continue to ante up for new homes in the face of rising borrowing costs on home mortgages and where confidence about economic prospects going forward continues to remain uncertain in most Americans' minds.
The Fed's unresolved question
"The data continue to point to the Federal Reserve's major unresolved question: Is the economy slowing enough to vent the pressure on labor markets and inflation?" said Steve Wood, a senior economist with Banc of America Securities in San Francisco.
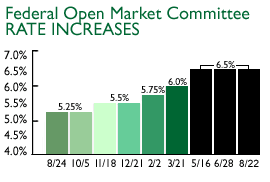 To discourage consumers from spending, the Fed has raised short-term rates six times since June 1999 to boost the cost of borrowing. The Fed's key benchmark rate currently stands at 6.5 percent. Most analysts expect that recent economic evidence indicating slowing growth and scant inflation pressures will continue to persuade Fed officials to hold the line on rates. To discourage consumers from spending, the Fed has raised short-term rates six times since June 1999 to boost the cost of borrowing. The Fed's key benchmark rate currently stands at 6.5 percent. Most analysts expect that recent economic evidence indicating slowing growth and scant inflation pressures will continue to persuade Fed officials to hold the line on rates.
But offsetting higher rates has been the rising value of investments, along with rising wages and benefits. While stock market volatility, particularly among high-tech companies, has caused concern among consumers, it hasn't yet damped their enthusiasm about their future economic prospects.
What has made them skittish is the prospect of a cooling job market in the wake of anecdotal evidence of dot.com layoffs and last month's employment report, which showed the sharpest drop in monthly employment in nearly a decade. Nonetheless, most analysts still are skeptical that consumers' concerns represent a notable economic slowdown.
Consumers remain upbeat
Currently, most on Wall Street are predicting that the Fed will hold the line on rates at its next policy meeting -- its last gathering before the presidential elections. History suggests that the Fed, which is not officially associated with any political party, does not alter its monetary policy leading up to a presidential election; it can raise or lower interest rates during an election period, but it has never done so.
 However, with recent economic indicators offering mixed signals on the growth and inflation fronts, there could be a chance Fed officials choose to move, either on Oct. 3 or at their subsequent meeting on Nov. 15 -- just eight days after election day, according to analysts and one Fed official. However, with recent economic indicators offering mixed signals on the growth and inflation fronts, there could be a chance Fed officials choose to move, either on Oct. 3 or at their subsequent meeting on Nov. 15 -- just eight days after election day, according to analysts and one Fed official.
"It is often said that in our next meeting, we cannot do anything because there are elections," William McDonough, president of the Fed Bank of New York, told the Santiago, Chile-based El Mercurio Tuesday. "That is a lie. It's all false. I can assure you that the political situation -- the fact that we are going to have a presidential election on Nov. 7 -- does not matter to us," he said.
Frank Cappiello, president of McCullogh Andrews & Cappiello, told CNNfn that he expects the Fed's recent spate of rate increases, the last being a half-point hike in mid-May, will slow growth in the months ahead as their effects make their way into the economy. (550KB WAV) (550KB AIFF)
Confidence at a plateau?
Lynn Franco, director of the Conference Board's consumer research center, feels the same way.
"Recent fluctuations may indicate that confidence levels have reached a plateau, and a cooling in spending habits may well be on the horizon," she said. "Despite the decline in confidence, consumers' attitudes about future economic growth prospects remain upbeat."
 The Conference Board's index uses 1985 as a base year of 100. About 5,000 households are surveyed on their attitudes toward business conditions, the employment situation and the prospects for bigger paychecks. The Conference Board's index uses 1985 as a base year of 100. About 5,000 households are surveyed on their attitudes toward business conditions, the employment situation and the prospects for bigger paychecks.
As for new home sales, which account for about 15 percent of all houses on the market, sales are on track to finish the year at 894,000, which would make it the second-highest year, after 907,000 homes in 1999.
With sales skyrocketing, the supply of available single-family homes plunged to 3.8 months' worth at the current sales pace, down from 4.6 months' worth in June. The July figure was the lowest since December 1998, when the supply also stood at 3.8 months' worth.
By region, sales increased 23.9 percent in the Midwest to 192,000 units at an annual rate. The increased 22.9 percent in the West to 258,000 units at an annual pace, were up 11.3 percent in the South to a 432,000-unit annual pace. Sales fell 11.4 percent in the Northeast to a 62,000-unit annual rate. 
|
|
|
|
|
 |

|