NEW YORK (CNNfn) - The battered euro took another beating Thursday, sinking to a record low due to a dismal outlook on the European currency, prompted in part by the European Central Bank's failure to raise interest rates as high as many had hoped.
In the Treasury market, month-end index buying coupled with weak economic data lifted bond prices.
The euro hit another record low at 88.40 cents against the dollar in intraday trading. Europe's common currency hovered just above its previous all-time low of 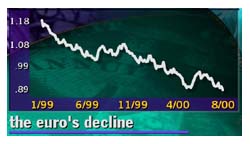 88.45 cents set May 4 in the past few sessions. It is now about 24 percent lower from its inception at $1.16 in January 1999. 88.45 cents set May 4 in the past few sessions. It is now about 24 percent lower from its inception at $1.16 in January 1999.
Analysts said disappointment that the European Central Bank (ECB) raised its benchmark rate by only a quarter-percentage point dragged it further down. Some speculated it would hike rates by a half-percentage point.
"The market is disappointed the ECB is not doing more on the interest rate front to support its currency," said Andrew Busch, director of foreign exchange at Bank of Montreal in Chicago.
Shortly before 3 p.m. ET, the euro was at 88.77 cents, down from 89.54 cents Wednesday, a 0.9 percent gain in the dollar's value.
With an environment of moderating growth and rising price pressures, the euro was struggling. In contrast, the U.S. economy continues to strongly outperform Europe with low inflation and with the perception the Federal Reserve is well on its way toward engineering a soft landing.
Meanwhile, the dollar rose slightly against the yen, trading at 106.75 yen compared with 106.55 yen Wednesday.
Treasurys climb
Treasury bonds ended sharply higher Thursday. Analysts attributed the majority of gains to month-end index buying, in which money managers fine-tune their portfolios to reflect the removal and addition of various fixed income securities.
Shortly before 3 p.m. ET, the benchmark 10-year Treasury note rose 14/32 of a point in price to 100-3/32. The yield, which moves inversely to price, fell to 5.73 percent from 5.80 percent Wednesday.
The 30-year bond gained 26/32 to 108-6/32, its yield retreating to 5.67 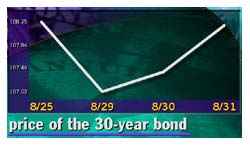 percent from 5.74 percent. percent from 5.74 percent.
Some economic reports showing signs of cooling growth also helped the market. The Chicago Purchasing Management Index (PMI), a measure of manufacturing activity in the region, fell to 46.5 in August compared with 52.0 in July.
The prices paid component, a measure of inflation, tumbled to 58.6 in August from 70.0 in the prior month.
"People think it's a further sign the economy may be slowing," said John Roberts, managing director of fixed-income at Barclays Capital, referring to the Chicago numbers.
In a separate report, U.S. jobless claims fell 3,000 to 318,000 in the week  ended Aug. 26, the Labor Department reported. ended Aug. 26, the Labor Department reported.
The Commerce Department said U.S. factory orders plunged 7.5 percent in July, the largest decline on record. The number was far above consensus estimates of a 6.1 percent drop.
But Treasurys still face two key hurdles -- Friday's U.S. employment report and the National Association of Purchasing Management's (NAPM) survey of manufacturing, both for August. 
|