|
Online ad winners, losers
|
 |
September 6, 2000: 7:36 p.m. ET
Lehman sees few winners, many losers in scramble for online ads
By Staff Writer David Kleinbard
|
NEW YORK (CNNfn) - In the online advertising market, the current big players are expected to remain big, while a few industry-specific Web sites will struggle for the remaining scraps of ad dollars.
That's the conclusion reached in a 24-page research report on Web advertising issued Wednesday by Lehman Brothers analyst Holly Becker. While Becker's conclusions aren't surprising, her report sheds new light on how much revenue Web sites need to become mainstays and which sites are likely to be around three years from now.
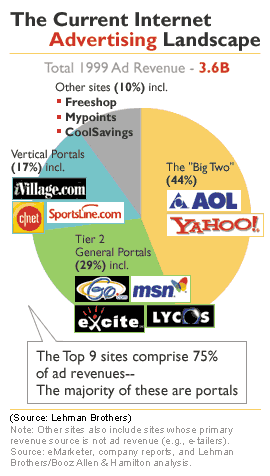
Becker's report is based on a study by Lehman Brothers and the consulting firm Booz Allen & Hamilton. Her report concludes that the "Big Two" Web portals - America Online and Yahoo! - will continue to receive the lion's share of Web advertising dollars. Those two companies collected about 44 percent of the $3.6 billion spent on Internet advertising in 1999. The top nine sites received 75 percent of all online advertising revenue, leaving more than 5,000 other commercial sites to scramble for the remainder.
America Online �(AOL: Research, Estimates) currently has a pending merger agreement with Time Warner, CNNfn's corporate parent.
$250 million to break even
According to Lehman's analysis, a Web portal needs $200-$250 million in revenue just to break even. AOL and Yahoo! (YHOO: Research, Estimates) are the only two portals to reach that revenue level, although Lycos (LCOS: Research, Estimates), Disney's Go Network, and Excite@Home are hovering at that level of advertising dollars. The latter three companies also derive substantial revenue from non-advertising sources.
While AOL and Yahoo! accounted for 44 percent of last year's advertising dollars, a group of companies Lehman's Becker calls "Tier 2 General Portals" took in 29 percent of the total spent on Web ads. Those Tier 2 companies include Go Network, Excite, Lycos �(LCOS: Research, Estimates) and the Microsoft Network.
Web portals focusing on one specific industry or interest group - including iVillage, CNET, and Sportsline.com - took in 17 percent of last year's ad spending. Because these industry-specific portals derive much more ad revenue per page view than general interest sites such as Yahoo!, they require fewer viewers to break even than the more broad-based sites, Becker said. Under the Lehman Brothers/Booz Allen model, general interest portals require 25 billion to 50 billion page views each year to break even.
Lehman expects online advertising revenue to rise to $13.5 billion by 2002 from $3.6 billion last year. Forrester Research issued a report last year estimating that online advertising spending would reach $33 billion by 2004, one-third of which will be spent outside of the U.S.
AOL, Yahoo!, and a handful of Tier 2 portals will capture almost 70 percent of online advertising spending in 2002, Lehman's Becker said. That would leave an estimated $4 billion in advertising revenue to be split by the remaining players. CNET (CNET: Research, Estimates) and ZDNet will capture about $700 million of the remaining $4 billion, she said, leaving the rest for "players struggling to break even." If portals require $250 million in revenue to enter the black, then only about 14 of the struggling players will manage to break even, she said.
Web stock consolidation
The end result is a handful of winners and hundreds of losers among dot.coms vying for ad dollars. There has already been major consolidation among Web companies, and that is likely to continue. As examples, CNET agreed in July to buy Ziff-Davis Inc (ZD: Research, Estimates) and its online subsidiary for approximately $1.6 billion in stock, creating one of the world's top producers of technology information. Also in July, online content and Web service company InfoSpace �(INSP: Research, Estimates) agreed to buy Web site network Go2Net Inc. for about $4 billion in stock. In addition, Spanish Internet service provider Terra Networks expects to close an $8.8 billion acquisition of Lycos by the end of October.
Financial distress among many of the smaller dot.com companies has created further challenges for the online advertising environment. In the past, Web companies used money they raised from stock offerings to advertise on other Web sites. This created the illusion that there was a booming market for online advertising, which, in turn, allowed more Web companies to do public stock offerings. With many smaller dot.coms going bankrupt, the market for Web company IPOs has dried up, and so may the fount of advertising dollars.
The high rate of dot.com failures has caused several analysts to question even the venerable Yahoo! In a report dated Aug. 28, Lehman's Becker said that Yahoo!'s outlook "remains worrisome."
"Our contacts suggest that the environment continues to worsen, and we believe it is only a matter of time before we see the impact on Yahoo!'s results," Becker wrote in that report.
In fact, Yahoo! CEO Timothy Koogle, speaking at the Robertson Stephens Internet Conference in San Francisco, Calif., said Wednesday that "a period of consolidation in dot-com advertising has taken away some of the upside." His comments caused the stocks of both Yahoo! and the Internet advertising firm DoubleClick (DCLK: Research, Estimates) to drop in after-hours trading.
Yahoo! lost $4.06 to $108 and DoubleClick shed 97 cents to $36.47 after Koogle's remarks. 
|
|
|
|
|
 |

|