|
Janus sees redemptions
|
 |
September 28, 2000: 12:36 p.m. ET
Fund industry's hottest name may have first monthly outflow in nearly 3 years
|
NEW YORK (CNNfn) - Janus fever may be breaking, or at least coming down, judging from recent fund sales numbers and net cash flow results for the month of September.Ā
Although it remains the best-selling fund group for the year by a long shot, according to the Financial Research Corp., the fund family, best known for its heavy technology investments and bonanza returns during the Nasdaq-led bull market of recent years, was nowhere to be found on FRC's list of the top 20 selling fund groups for August 2000.
What's more, the company has seen shareholders pull out $68.3 million of its retail equity funds in September through Monday, the 25th, according to Janus spokeswoman Shelly Grice. If that trend continues through the end of the month, it will mark the fund family's first monthly negative net cash flow in its retail equity funds in nearly three years.
Tough market, tough access
The downturn can be hung on a few factors. The first is the fact that Janus has closed half of all its funds to new investment, five of them this year alone, following a huge influx of money in the first part of the year, said Morningstar fund analyst Christine Benz.
Through the end of August, Janus has rung up $37.8 billion in net sales this year, more than $20 billion more than Putnam, the No. 2 best-selling fund family, according to data from FRC.
 The second factor, Benz said, is a lackluster year for many Janus funds. While Janus has shown itself to be terrific at managing money in an aggressive growth-oriented market, she added, the firm has been very beholden to that style being in favor. This year, at least since the spring, that style has made for tough going.Ā The second factor, Benz said, is a lackluster year for many Janus funds. While Janus has shown itself to be terrific at managing money in an aggressive growth-oriented market, she added, the firm has been very beholden to that style being in favor. This year, at least since the spring, that style has made for tough going.Ā
Year to date, only 32.14 percent of Janus funds are outperforming their peers, according to data from Morningstar. On a three-year basis, that number jumps to 96 percent.
"People had come to expect the world of them," Benz explained. "(They're) a little disappointed."
Grice acknowledges a lot of people are sitting on the sidelines, although she noted that Janus' more conservative money market and fixed income funds have seen positive cash flow for the month of September. Given market volatility, she said, "we're not surprised to see a significant slowdown."
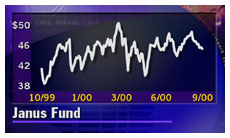
Another issue, the surprise departure of Janus' chief investment officer Jim Craig earlier this month, does not seem to be a factor in the net outflows. After all, Benz said, "Janus Fund (which Craig used to manage) is clicking along pretty well." So far this year, the fund is up 2.86 percent; on a 1-year basis it is up 30.24 percent.
Should you worry?
For the Janus fund holder, the outflow of cash is not necessarily a bad thing, Benz said. Fund managers, rather than having to dispense with truckloads of new cash heaped upon them, will be able to take their time to find good investment opportunities.
What's more, it is not as if the $68 million figure in net outflow is anywhere near big enough to force fund managers to sell any of their holdings to make up for the cash loss, she said.
Nevertheless, she advises Janus investors to keep their eyes on fund performance and developments at Janus, which recently was spun off from parent Kansas City Southern Industries along with its other financial services businesses into a new entity called Stilwell Financial, a move Janus officials had publicly opposed. 
|
|
|
|
|
|
Janus
|
Note: Pages will open in a new browser window
External sites are not endorsed by CNNmoney
|
|
|
|
 |

|