|
New home sales slip
|
 |
October 3, 2000: 12:25 p.m. ET
August sales down 3%; leading economic indicators also decline
|
NEW YORK (CNNfn) - New U.S. home sales slipped in August from their rapid pace a month earlier, while the index of leading economic indicators posted its fourth consecutive monthly decline, according to two separate economic reports Tuesday.
The figures, released while Federal Reserve policy makers were beginning their bimonthly meeting, are the final pieces of the economic puzzle that the Fed will review during the gathering. Most economists expect the Fed will leave interest rates unchanged, saying the central bank does not need to act to cool off the U.S. economy because there are many signs the sizzling pace of economic growth is slowing.
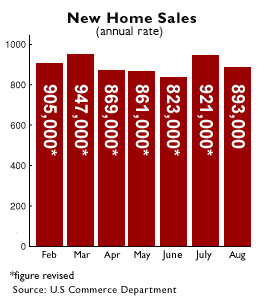
Commerce Department data showed the number of new single-family homes sold in August fell about 3 percent to a seasonally adjusted annual rate of 893,000 units from a downwardly revised rate of 921,000 in July. The July rate previously originally came in at a torrid 944,000, nearly a 15 percent jump over the June rate and well above analysts' forecasts.
The August sales figure was roughly in line with forecasts. Analysts expected an annual rate of 895,000 units sold in August, according to a survey by Briefing.com. The August pace was 2.3 percent below August 1999 levels.
 Despite the fall-off in August home sales, the housing market is still quite healthy, said Michael Moran, chief economist at Daiwa Securities. Despite the fall-off in August home sales, the housing market is still quite healthy, said Michael Moran, chief economist at Daiwa Securities.
"If you average through what we've seen over the past several months you're looking at a very strong pace of home sales, right in line with the average that we had last year, and last year was a record year for home sales," he told CNNfn's "Market Call." "So I think we're still doing very well in the housing market."
The August sales drop was felt in all regions of the country. Sales fell 6 percent in the West, after a 24.3 percent surge in July. Sales slipped 2.4 percent in the South, 1.6 percent in the Midwest, and 1.5 percent in the Northeast.
Despite the falling number of homes sold, the mean price of a new home sold climbed nearly 3 percent to $203,000, from $197,100 in the prior month. The median sales price slipped slightly to $165,000, from $166,100 in August.
The figures are more evidence of stability in the economy, said David Orr, chief economist at First Union.
"The trend of new home sales could be used as the 'poster boy' for a soft landing" for the economy, he wrote in a research report. "No doubt the drop in mortgage rates has cushioned sales, and that relative stability is a key reason the Fed will decide to keep rates steady."
However, the market for previously owned homes is showing a rebound. Last week, the National Association of Realtors reported that sales of existing homes climbed 9.3 percent in August, the fastest rate in more than a year. Economists credited falling mortgage rates for the sales pickup.
LEI in line with targets
Meanwhile, a report Tuesday by the Conference Board also showed the economy may be slowing. The index of leading indicators, a gauge meant to forecast the outlook for the U.S. economy, slipped 0.1 percent to 105.7 in August, following a revised 0.2 percent decline in July.
The latest reading matched analysts' expectations. The New York-based research group uses previously reported economic statistics to compile the index.
"The flat pace in the leading indicators points to continued moderation in U.S. economic activity," Conference Board economist Ken Goldstein said in a statement. "This is reflected in indicators for manufacturing, housing, consumer, labor, and financial markets. The economy is starting to reflect the impact of growth restraints."
Six of the 10 indicators that make up the leading index fell in August, including average weekly manufacturing hours, average weekly initial claims for unemployment insurance, and building permits. Positive contributors included money supply, manufacturers' new orders for non-defense related goods, manufacturers' new orders for consumer products, and stock prices.
The report's coincident index, which measures current business activity, rose 0.2 percent in August, following a flat reading in July. The lagging index, which measures such things as outstanding orders for goods and outstanding loans, edged up 0.3 percent, after no change in July. 
|
|
|
|
|
 |

|