|
Gap sees lower 3Q earnings
|
 |
November 1, 2000: 5:42 p.m. ET
Sluggish comparable-store sales trim clothing retailer's profit outlook
|
NEW YORK (CNNfn) - Casual wear retailer Gap Inc. on Wednesday warned that its third-quarter profit would fall short of analysts' estimates, hurt by a drop in sales at stores open at least one year.
The San Francisco-based clothier said that third-quarter earnings per share will fall in the range of 20 cents-to-22 cents a share. Analysts surveyed by First Call on average had expected a profit of 23 cents. The projections of the 26 analysts had ranged from 20 cents to 31 cents, First Call said.
 Third-quarter sales are expected to reach $3.41 billion, the company said, up 12 percent from $3.05 billion for the same period in 1999, and higher than the $3.36 billion forecast by analysts. Third-quarter sales are expected to reach $3.41 billion, the company said, up 12 percent from $3.05 billion for the same period in 1999, and higher than the $3.36 billion forecast by analysts.
But Gap's (GPS: Research, Estimates) third-quarter comparable store sales decreased 8 percent, compared to a prior year increase of 5 percent.
"October was a big clearance month for us, which produced margins well below last year, with each of our brands focused on getting the stores ready for the critical holiday season," said Gap Chief Financial Officer Heidi Kunz, in a statement.
"The key drivers of our results will be a significant decline in gross margin versus last year and an increase in operating expense as a percent to sales," said Kunz, who added that the quarterly results would be released November 9.
Gap, which operates 3,542 stores, noted that third-quarter comparable-store sales will be lower than the year before for is Gap Domestic, Old Navy and Banana Republic brands.
In August, Gap warned that its saw "risks and challenges in third and fourth quarters," due to the steady sales declines at its signature stores.
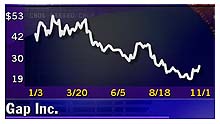
On Wednesday, shares of Gap fell $1.38 to $24.44. 
|
|
|
|
|
|
Gap
|
Note: Pages will open in a new browser window
External sites are not endorsed by CNNmoney
|
|
|
|
 |

|