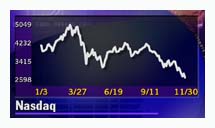
NEW YORK (CNNfn) - With the stock market gyrating wildly to the downside following Election Day and its muddled results, it's worth taking a look at where it came from and how it got where it is. The year 2000 has been marked by a roller coaster effect, with stock prices whipsawed by sharp swings in the economy, the loud pop of the Internet bubble bursting, political uncertainty and continued speculation about Federal Reserve policy.
 The Dow started off strong, setting a record high of 11,722 early in January, and then getting hammered in October and November. The NASDAQ composite, after an incredible 85 percent explosion in 1999, set its all-time high of 5,048 in March, only to lose half that gain in the post-election sell-off. The Fed raised interest rates three more times (for a total of six during the round of tightening that started in mid-1999) then stood pat, waiting for the economy to slow, which it did in the third quarter, leaving everyone to wonder whether the landing will be soft or hard and how soon the central bank will decide to ease. The Dow started off strong, setting a record high of 11,722 early in January, and then getting hammered in October and November. The NASDAQ composite, after an incredible 85 percent explosion in 1999, set its all-time high of 5,048 in March, only to lose half that gain in the post-election sell-off. The Fed raised interest rates three more times (for a total of six during the round of tightening that started in mid-1999) then stood pat, waiting for the economy to slow, which it did in the third quarter, leaving everyone to wonder whether the landing will be soft or hard and how soon the central bank will decide to ease.
Inflation remained tame, productivity continued hot and the nation's jobless rate matched a three-decade low. Corporate mergers and acquisitions picked up steam, with regulators in the United States and Europe squashing or delaying some high-profile deals and approving others. The big antitrust news was the Justice Department's suit against Microsoft and the judge's order to break up the company, a ruling that is under appeal. The dollar soared, the Euro tanked, and the U.S. bond market see-sawed, then moved higher. And the revolving door in the executive suites of corporate CEOs reached a new degree of intensity.
So the year that started with a huge sigh of relief over the non-appearance of Y2K disruptions has moved into its final month in a high state of uncertainty in business, finance -- and politics.
 The stock market wound up November with a big sell-off, although both the Dow industrials and the NASDAQ composite each erased about a third of their earlier losses on Thursday. Nevertheless, it was the second worst month in the NASDAQ's history, the loss of nearly 23 percent topped only by the 27 percent meltdown in October, 1987. The Dow, however, dropped only 5 percent for the month. The stock market wound up November with a big sell-off, although both the Dow industrials and the NASDAQ composite each erased about a third of their earlier losses on Thursday. Nevertheless, it was the second worst month in the NASDAQ's history, the loss of nearly 23 percent topped only by the 27 percent meltdown in October, 1987. The Dow, however, dropped only 5 percent for the month.
Being of a generally optimistic frame of mind, I have to restrain myself from viewing the market's glass as still half-full, even while it may be rapidly emptying. But I am sticking to my view that most -- though not all -- of the recent weakness was due to the Presidential election mess. On top of that, other negative considerations -- both real and potential -- came into view. Earnings warnings, most recently from Gateway, have weighed on the market.
And there are concerns over the slowing economy. I'm reserving my opinion on how soft or hard the landing will be. Despite some talk of doom and gloom, even hints of an impending recession, I'm waiting until more data is available. And I do think the Fed will act quickly to cut rates if necessary. It's worth keeping in mind that the recent revision of the third-quarter gross domestic product down to an annualized growth rate of 2.4 percent still puts it near the high end of the Fed's target just a few years ago. And getting the economy to slow down is exactly what Alan Greenspan and his Fed colleagues intended when they started raising interest rates 17 months ago.
There isn't much to cheer about on Wall Street right now. But I still think that when the Presidential outcome is finally decided, the stock market will stage a solid rally. Who knows, though, when that will happen. 
|

