|
Hasbro warns on 4Q
|
 |
December 6, 2000: 6:07 p.m. ET
Toymaker says it could lose 20-to-40 cents a share in 4Q; hikes job cuts to 750
|
NEW YORK (CNNfn) - Hasbro Inc. warned Wednesday that it would badly miss fourth quarter and full year 2000 earnings projections, while also raising the number of jobs being cut to 750 positions.
Before one-time charges of $140 million to $170 million, Hasbro expects earnings per share for full year 2000 to at best break even, with a potential loss of between 10 cents to 20 cents a share. This would equal a 20 cent to 40 cent a share loss for the fourth quarter. Earnings tracker First Call expected earnings of 43 cents a share for 2000 and 23 cents a share for fourth quarter 2000.
 Hasbro, which makes Pokeman and Star Wars products, said the reduced expectations were due to the global revenue decline in trading card games. Hasbro, which makes Pokeman and Star Wars products, said the reduced expectations were due to the global revenue decline in trading card games.
"Frankly, while Pokemon Trading Card Game cards are still selling well, we were too aggressive in our forecast following incredible demand in 1999 and 2000," said Hasbro CEO Alan Hassenfeld.
In October, the nation's No. 2 toy maker, warned that it would be cutting about 500 to 550 jobs. Hasbro boosted that projection to 750 Wednesday, more than 9 percent of its 9,500 work force, a company spokesman said.
Pawtucket, R.I.-based Hasbro �(HAS: Research, Estimates) is also selling its Hasbro Interactive and Games.com units to French entertainment firm Infogrames Entertainment SA for about $100 million in cash and stock. Of the sale, Hasbro will receive $5 million in cash and the other $95 million in Infogrames Entertainment securities, a spokesman said.
"While 2000 has been a very painful year, we are looking forward to returning Hasbro to profitability in 2001 and beyond," Hassenfeld said.
Hasbro also cut its quarterly cash dividend to 3 cents a share from 6 cents, effective with the dividend payable in February.
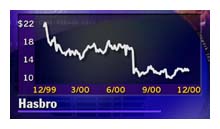
Hasbro lost 19 cents to close at $11.56 Wednesday. 
|
|
|
|
|
 |

|