|
U.S. producer prices flat
|
 |
December 14, 2000: 11:32 a.m. ET
November wholesale prices rise 0.1%; ex-food and energy, prices unchanged
By Staff Writer M. Corey Goldman
|
NEW YORK (CNNfn) - U.S. wholesale prices barely budged in November while the so-called "core" producer price index was flat, the government reported Thursday – the latest signs that inflation remains subdued and is no threat to the economy's record expansion.
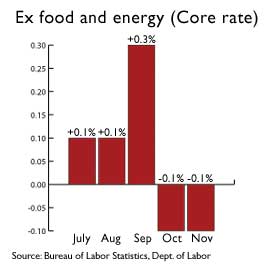
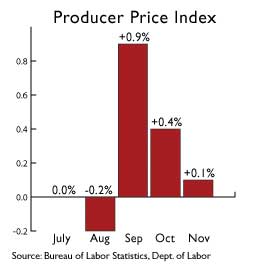 Wholesale prices edged up 0.1 percent last month, the Labor Department said, in line with economists' forecasts and below October's 0.4 percent rise. The core rate, which excludes often volatile food and energy costs, came in unchanged, versus forecasts of a 0.1 percent rise and the 0.1 percent decline posted a month earlier. Wholesale prices edged up 0.1 percent last month, the Labor Department said, in line with economists' forecasts and below October's 0.4 percent rise. The core rate, which excludes often volatile food and energy costs, came in unchanged, versus forecasts of a 0.1 percent rise and the 0.1 percent decline posted a month earlier.
The report offered the latest piece of evidence that the U.S. economy is slowing and that inflation remains under wraps -- two more pieces of data that could convince Federal Reserve policy makers to drop their inflation-fighting stance at their meeting on Tuesday.
"Not only is the economy slowing but it is a reminder that inflation risks diminish as the economy slows," said Paul Christopher, an economist with A.G. Edwards & Sons in St. Louis. "It emphasizes that the Fed would be quite well justified for easing policy as early as next week, a move to a neutral bias with a rate cut being the next logical step in January."
Good news for the Fed
Wholesale prices can feed into inflation at the retail level because prices for goods and services are influenced by what producers' costs for raw materials are. If prices at the wholesale level are tame, companies that produce those goods don't have to lift their prices to offset rising costs.
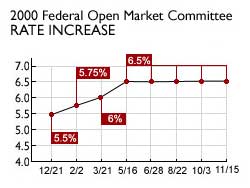
The Fed raised rates six times starting in mid-1999 in a bid to slow the economy and ward off inflation, but has held rates steady at its last four meetings. Still, despite a slew of reports pointing to slower growth, the central bank has kept its official stance as leaning toward raising rates again, if needed.
Most on Wall Street expect that will change next Tuesday, when Fed officials gather in Washington for their last meeting of the year. They are also anticipating that, unless fresh evidence emerges that the economy isn't slowing down, that the Fed will lower rates at its Jan. 30-31 meeting.
So far, the evidence points to the contrary. The U.S. economy expanded at a 2.4 percent pace in the third quarter, less than half the 5.6 percent pace recorded in the second quarter and the slowest advance in four years. Analysts polled by Briefing.com expect growth to ring in at around 3 percent for the fourth quarter.
"The numbers confirm the perspective that the market has already priced in -- that the Fed will move to a neutral directive at its meeting next week," Maria Ramirez, international economist of Maria Fiorini Ramirez, Inc., told CNNfn's Before Hours. (381KB WAV) (381KB AIFF)
Inflation remains subdued
Through November, the overall PPI advanced at a 3.9 percent annual rate, compared with a 3 percent pace in the same 11 months last year. The core PPI has increased at a 1 percent annual rate, compared with a 0.8 percent pace in the same period a year ago.
 Energy prices rose 0.4 percent in November after jumping 1.4 percent the month before. Residential natural gas prices rose 1.2 percent and gasoline prices rose 1.4 percent, but electric power prices dropped 0.7 percent while heating oil prices fell 1.9 percent. Elsewhere, consumer foods prices rose 0.2 percent and passenger car prices edged up 0.1 percent. Energy prices rose 0.4 percent in November after jumping 1.4 percent the month before. Residential natural gas prices rose 1.2 percent and gasoline prices rose 1.4 percent, but electric power prices dropped 0.7 percent while heating oil prices fell 1.9 percent. Elsewhere, consumer foods prices rose 0.2 percent and passenger car prices edged up 0.1 percent.
The report offered some insight into Friday's consumer price index report, due to be released by the Labor Department at 8:30 a.m. ET. Economists polled by Briefing.com expect that prices at the consumer level advanced at a 0.2 percent pace last month. The core rate, which strips out food and energy prices, is also expected to have risen 0.2 percent.
The report further confirmed the anecdotal evidence from manufacturing companies recently that they are unable to raise end-product prices despite the surge in energy costs," said David Orr, chief economist at First Union Securities.
Current account deficit hits record
Separately, the Commerce Department reported that the U.S. trade deficit in goods, services and investments widened to a record in the third quarter as imports grew faster than exports and as international investors earned more on their U.S. investments than Americans did abroad.
The current account deficit, the broadest measure of international trade because it includes financial transactions, grew to $113.8 billion in the third quarter after widening to $105 billion in the second, Commerce said.
The shortfall represents money the U.S. has to borrow overseas to pay for all the goods and services Americans import. A wider deficit as a percentage of GDP could eventually hurt confidence in the U.S. dollar if investors start to question the country's ability to meet its obligations, according to analysts.
In another report, the Labor Department said that claims for new unemployment benefits fell by 32,000 to 320,000 last week, the biggest drop in almost five months, but still an indication of a tight labor market. 
|
|
|
|
|
 |

|