|
Housing starts edge up
|
 |
January 18, 2001: 2:45 p.m. ET
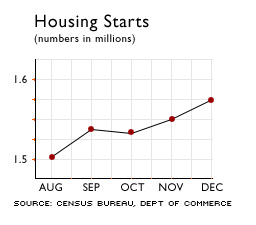
December starts climb 0.3% to 1.575 million unit annual rate
|
NEW YORK (CNNfn) - The number of new homes under construction in the United States edged up to the fastest pace in seven months in December as falling mortgage rates prompted a spurt of single-home building activity, a government report released Thursday showed.
U.S. housing starts rose 0.3 percent in December to a seasonally adjusted annual rate of 1.575 million, the Commerce Department said. They were �boosted primarily by a jump in construction of single-family homes, which rose 6 percent last month. Analysts polled by Briefing.com had expected starts to slip to a 1.50 million rate.
For the year, however, the number of housing starts reached its lowest level since 1997, the Commerce Department said, at a non-seasonally adjusted 1.594 million.
 "With mortgage applications back to their pre-holiday highs, we think builders will soon be more cheerful, so we expect starts to being rallying more strongly over the next few months," said Ian Shepherdson, chief U.S. economist with High Frequency Economics. "With mortgage applications back to their pre-holiday highs, we think builders will soon be more cheerful, so we expect starts to being rallying more strongly over the next few months," said Ian Shepherdson, chief U.S. economist with High Frequency Economics.
The average rate on a 30-year mortgage was 7.04 percent last week, according to the Mortgage Bankers Association of America. The group's mortgage applications index surged 44.6 percent last week to the highest level in more than two years.
Single starts rose 6 percent to 1.313 million, while starts of multiple units plunged 20.8 percent to 262,000. For the full year, housing starts rang in at a 1.594 million unit pace, down from a 1.667 million rate for all of 1999.
Building permits, meantime, an indicator of future construction, fell 6.6 percent to 1.493 million at an annual rate after rising 3.4 percent in November. The December pace was the slowest since 1.486 million in August. 
|
|
|
|
|
 |

|