|
Merrill 4Q tops estimates
|
 |
January 23, 2001: 2:35 p.m. ET
No. 1 brokerage tops forecasts by 5 cents a share, cites strong revenue
|
NEW YORK (CNNfn) - Merrill Lynch, the largest U.S. brokerage firm, topped Wall Street forecasts Tuesday for its fourth-quarter earnings on strong revenue from assisting clients with mergers and acquisitions.
Merrill reported fourth-quarter earnings of $877 million, or 93 cents a share, 5 cents better than the First Call consensus estimate of 88 cents and 11 percent higher than the $793 million, or 91 cents a share, earned a year earlier.
Revenue for the quarter increased 4 percent to $6.3 billion.
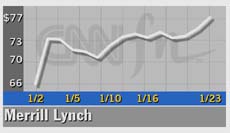
 Shares of Merrill Lynch (MER: Research, Estimates) rallied to a new 52-week Tuesday afternoon, soaring $4, or 5.3 percent, to $79.12. Shares of Merrill Lynch (MER: Research, Estimates) rallied to a new 52-week Tuesday afternoon, soaring $4, or 5.3 percent, to $79.12.
Merrill, like its competitors in the financial services sector, has experienced a slowdown in retail volume as investors pulled back from a declining stock market in the wake of a weaker economy.
However, Merrill offset those declines by ramping up its mergers and acquisitions services during the quarter. Revenue from those services increased 6 percent to $435 million.
"The key with Merrill is they're not as dependent on some of the venture capital private equity gains some of these companies earned earlier in the year, but have now lost," Diana Yates, an analyst with A.G. Edwards & Sons Inc., said.
Yates, who has an accumulate rating on the company, said Merrill stands out from the pack because its revenue mix is more diversified than other competitors, which also have seen losses in underwriting of initial public offerings. "It's more their diversification. The business revenue mix is not all from the IPO activity."
IPOs set a record pace during the first quarter of 2000, when 141 companies went public, but the new issues market ground to a halt during the fourth quarter amid the technology sell-off, overall market volatility and the uncertainty over the presidential election.
Click here to see how other financial services firms are doing
Merrill cited a "sharp improvement" in profitability from its U.S. private client group despite lower trading volume. A big part of that was a number of cost-cutting measures enacted during the year as well as steady revenue from some asset-based services, Merrill said.
Corporate and institutional services also grew, with earnings increasing 10 percent from a year earlier to $749 million, and net revenue of $2.8 billion.
However, underwriting revenue -- money earned from assisting with initial public offerings -- declined 6 percent to $673 million in the quarter.
For the full year, Merrill's earnings rose 41 percent to $3.8 billion, or $4.11 a share, from $2.7 billion, or $3.11 a share, a year earlier.
"We had record results in 2000 and the year was a landmark in many ways," CEO David Komansky said. "We made great strides toward many of our strategic and financial goals. The strength of our fourth-quarter performance, in the midst of challenging markets, underscores the breadth of our global franchise and the benefit of expanding fee-based revenues."
Merrill managed $1.7 trillion in private client accounts during the year. The company brought $150 billion in new money to private client accounts during the year, $38 billion of it in the fourth quarter.
During the quarter, the company launched a joint online venture with HSBC Holdings PLC, an international banking and financial services company based in England, to provide investment and banking services in Canada and Australia.
The slowing economy and recent market downturns caused a global decline in client transactions, which in turn decreased Merrill's commission revenue 11 percent to $1.5 billion in the quarter. However, those declines were offset as clients shifted to asset-priced services from traditional transaction-priced accounts. 
|
|
|
|
|
 |

|

