|
Exxon sets profit record
|
 |
January 24, 2001: 1:14 p.m. ET
Company logs $17.7B income, most of any corporation; other oil profits also up
|
NEW YORK (CNNfn) - Exxon Mobil Corp. wrapped up its first full year as a combined company with the most profitable year of any corporation in history, as soaring oil prices lifted the profits for the nation's largest oil companies.
Exxon Mobil nearly doubles profit
Exxon Mobil Corp., the world's largest oil company, earned $5.1 billion, or $1.46 a share, excluding the effects of its merger of a year ago, when fourth quarter earnings came in at $2.7 billion, or 77 cents a share. Analysts surveyed by earnings tracker First Call were looking for earnings of $1.31 a share in the most recent period.
 The company attributed the gain to historically high crude oil and natural gas prices, higher refining margins and improved operating efficiencies, including those gained from the merger. The company attributed the gain to historically high crude oil and natural gas prices, higher refining margins and improved operating efficiencies, including those gained from the merger.
Including net favorable merger effects, the company earned $5.2 billion, or $1.49 a share, in the fourth quarter, up from $2.3 billion, or 65 cents a share, on the same basis a year earlier.
According to First Call the quarter marked the most profitable quarter ever posted by any company, beating the record Exxon Mobil set in the third quarter. For the year it set another record with net income of $17.7 billion, or $5.04 a share, up from $7.9 billion, or $2.25 a share, it earned in 1999.
Sales at the company rose 17 percent in the quarter to $64.1 billion from $54.6 billion a year earlier.
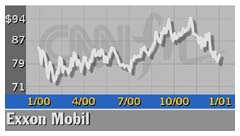
Shares of Exxon Mobil (XOM: Research, Estimates) lost 56 cents to $81.25 in trading Wednesday.
Texaco, Chevron post strong profit gains
No. 2 U.S. oil company Texaco Inc., which is the process of being purchased by No. 3 Chevron Corp., saw earnings excluding special items more than double to $840 million, or $1.55 a share, in the fourth quarter. First Call's forecast called for $1.51 a share in the period. The company earned $370 million, or 67 cents a share, in the year earlier period.
Sales at Texaco rose 37 percent to $14.4 billion from $10.6 billion a year earlier.
 Including special items net income came to $545 million, or $1.00 a share in the quarter, up from $318 million, or 58 cents a share, a year earlier. Including special items net income came to $545 million, or $1.00 a share in the quarter, up from $318 million, or 58 cents a share, a year earlier.
The company did not give any specific earnings guidance in the release, although it said it is confident it can continue to deliver strong results, and that the merger discussions are going well and that a closing of the deal is expected in the middle of this year.
 Chevron reported earnings of $1.5 billion, or $2.39 a diluted share, excluding special items, although First Call said that analysts will probably consider earnings to have reached $2.40 a share because of excluding a foreign currency loss in the period. That's better than the First Call forecast of $2.21 a share. The company earned $819 million, or $1.24 a share, a year earlier. Chevron reported earnings of $1.5 billion, or $2.39 a diluted share, excluding special items, although First Call said that analysts will probably consider earnings to have reached $2.40 a share because of excluding a foreign currency loss in the period. That's better than the First Call forecast of $2.21 a share. The company earned $819 million, or $1.24 a share, a year earlier.
Including special items net income came to $1.5 billion, or $2.32 a share, up from $809 million, or $1.23 a share, a year earlier.
Sales gained 24 percent in the period to $13.2 billion from $10.6 billion a year earlier.
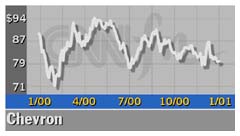
Shares of Texaco (TX: Research, Estimates) edged up 6 cents to $58.81, while shares of Chevron (CHV: Research, Estimates) were off 6 cents to $79.50.
Occidental misses the mark
Occidental Petroleum Corp. announced earnings of $349, or 94 cents a share, before special items. While that's up from the $192 million, or 52 cents a share, of a year earlier, it's below the $1.05 a share forecast from First Call.
The company's chemical business, where the higher oil prices increased costs, posted an operating loss before special items of $51 million, compared to an operating profit of $70 million a year earlier. Its oil and gas business operating profit before special items more than doubled though to $763 million from $331 million a year earlier.
Click here to check on other energy stocks
Overall sales at the company rose 50 percent to $3.9 billion from $2.6 billion a year earlier. Oil and gas sales rose even faster to $3.1 billion from $1.6 billion, while chemical revenue fell to $797 million from $942 million a year earlier.
Shares of Occidental (OXY: Research, Estimates) lost 31 cents to $22.69 in trading Wednesday. 
|
|
|
|
|
 |

|

