|
Corning tops 4Q forecast
|
 |
January 24, 2001: 5:06 p.m. ET
Fiber-optic-cable giant's profit beats the Street by 6 cents per share
|
NEW YORK (CNNfn) - Corning Inc. on Wednesday reported a fourth-quarter profit that exceeded Wall Street's expectations on sales that rose more than 50 percent from the same period a year earlier, but said softness in the telecommunications market could weigh on its first-quarter results.
The world's leading supplier of fiber-optic cable reported pro forma earnings of $314.6 million, or 34 cents per share, excluding one-time charges.
That compares with the $142.2 million, or 18 cents per share, profit it logged during the same period a year earlier and is 6 cents more than the 28 cents per share analysts had generally expected, according to a survey conducted by earnings research firm First Call.
Accounting for charges, Corning's loss from continuing operations for the fourth quarter of 2000 totaled $70.2 million, or 8 cents per share, compared with income of $145.6 million, or 18 cents per share, for the fourth quarter of 1999.
At $2.1 billion, Corning's fourth-quarter revenue rose 52 percent from $1.4 during the year-ago period. Wall Street had been expecting the company to report fourth-quarter revenue of roughly $2.1 billion, according to the First Call survey.
Excluding the impact of acquisitions, sales increased 36 percent year-to-year, Corning said.
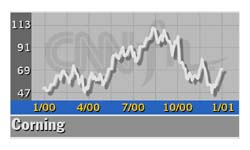
Shares of Corning (GLW: Research, Estimates) fell 88 cents to $69.12 on the New York Stock Exchange ahead of the earnings report, which was released after the closing bell. They slipped another $4.72 to $64.50 in after-hours trade.
Click here to see which stocks are moving after hours
Corning executives attributed the strong results to soaring demand for optical fiber and components used in high-speed communications networks.
 For all of 2000, Corning logged total revenue of $7.1 billion, an increase of 50 percent from $4.7 billion in 1999. For all of 2000, Corning logged total revenue of $7.1 billion, an increase of 50 percent from $4.7 billion in 1999.
During the year, Corning closed a dozen strategic acquisitions valued at roughly $10 billion. Excluding the impact of acquisitions, the company said its sales in 2000 were up 36 percent over 1999.
Excluding acquisition-related and other one-time charges, Corning said its pro forma earnings per share for 2000 were $1.23, an increase of 84 percent from 67 cents per share in 1999.
Including charges, Corning reported full-year-2000 income from continuing operations of $409.5 million, or 46 cents per share, compared with $511 million, or 65 cents per share in 1999.
Looking ahead, James B. Flaws, Corning's chief executive, said the company is expecting some softness in the first quarter as telecommunications services providers work through "ongoing issues with capital availability."
As a result, Flaws said the company is widening its earnings-per-share guidance range to between 28 cents and 31 cents from its previous range of 29 cents to 30 cents.
"With this new guidance range, earnings per share would be up 20 percent to 35 percent from the prior year," Flaws said. He said he expects sales in the first quarter to be down slightly from the fourth quarter, coming in between $1.9 billion to $2 billion.
Even so, Flaws reaffirmed Corning's earnings-per-share expectations for all of 2001, saying the company still expects to log an operating profit in the range between $1.40 and $1.43 per share.
"By reallocating fiber volume to previously unmet customer needs, adding new customers for optical amplifiers and other optical components, and by controlling spending, we are very confident that we will achieve our full-year guidance," he said. "We continue to believe sales for 2001 will reach $9 billion." 
|
|
|
|
|
 |

|