|
Nasdaq's year of pain
|
 |
March 9, 2001: 12:49 p.m. ET
A year after the euphoria, technology investors face reality
By Staff Writer Jake Ulick
|
NEW YORK (CNNfn) - The Nasdaq composite index is celebrating the one-year anniversary of its record high Saturday. But nobody is throwing a party.
Since peaking, the Nasdaq has tumbled 59 percent, deflating a technology stock bubble that, while it lasted, turned the market into a money machine and national pastime.
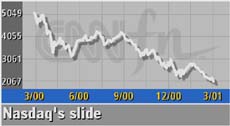
What a difference a year makes. Twelve months ago, the Nasdaq closed at 5,048.62. Its 16th record high of the year came on top of an 86 percent gain in 1999.
Now the Nasdaq, after sliding 39.2 percent last year, is down 16 percent in 2001 and hovers at levels not seen since late 1998. Investors who once fixated on their portfolios would rather not look.
 A lot has changed in twelve fast months. A once hard-charging economy slowed while investor sentiment darkened. Optimism about the growth prospects for technology companies has given way to fears about the risks of those very same firms. A lot has changed in twelve fast months. A once hard-charging economy slowed while investor sentiment darkened. Optimism about the growth prospects for technology companies has given way to fears about the risks of those very same firms.
Earnings and interest rates, once deemed of scant importance, now matter. For stock market bears, who once were accused of misunderstanding the new rules of a "new economy," there's vindication.
"Euphoria can only go on for a certain amount of time," said Marc Klee, who manages the John Hancock Global Technology Fund. "Eventually reality wins out."
Recent months have brought plenty of reality. Microsoft (MSFT: Research, Estimates), Sun Microsystems (SUNW: Research, Estimates), Oracle (ORCL: Research, Estimates) and Intel (INTC: Research, Estimates), once among the most dependable of companies, all have warned that profits or sales will miss forecasts.
When the Nasdaq peaked, the U.S. economy was growing at a 5.4 percent clip. Economists now expect little if any growth for this quarter.
When the Nasdaq peaked, the Federal Reserve was raising interest rates to keep the economy from overheating. Now, the central bank is cutting rates to avoid a recession.
But changes in economic and corporate fundamentals tell just part of the story. The mania that drove tech stock valuations to levels beyond precedent has something to do with sentiment.
Consider Qualcomm. When 1999 began, the maker of wireless communications equipment traded at about $6. At the start of last year, its shares had soared above $176. Qualcomm (QCOM: Research, Estimates) now trades at $54.
 "Like the Great Tulip Mania in Holland in the 1600's and the dot.com mania of early 2000, markets have repeatedly disconnected from reality," said Tony Crescenzi, analyst at Miller, Tabak & Co. "Like the Great Tulip Mania in Holland in the 1600's and the dot.com mania of early 2000, markets have repeatedly disconnected from reality," said Tony Crescenzi, analyst at Miller, Tabak & Co.
The boom and bust cycle enforced several investing truisms. One may be the difficulty of picking the top and bottom of any market. Timing peaks and troughs is nearly impossible, caution money managers who advise taking a long-term approach to investing.
The past 12 months also underscore the value of diversifying among sectors. With technology stocks falling, drug, real estate investment trusts, utilities and food stocks all posted smart gains.
The Nasdaq's rise and fall has been dramatic:
- Just two months before it peaked, the index crossed 4,000 for the first time. But a month later, on April 12, it was back below 4,000 again.
- By June 20 of last year, the Nasdaq was back above 4,000 and stayed near there until the beginning of September.
- Then the bottom fell out. The Nasdaq sliced below 3,000 by early November amid the start of an eventual deluge of companies warning that profits or sales would fall short.
A year ago today, many analysts thought that technology stocks were impervious to higher interest rates. They were wrong. Technology spending, some said, would continue even if the economy cooled.
Oracle �(ORCL: Research, Estimates) proved otherwise. The company last week joined hundreds of firms saying that a slowdown in business orders for its software would cause the company to miss profit expectations.
But the Nasdaq's deflation was hardly monolithic. The Internet stocks were among the first to go, with Amazon.com �(AMZN: Research, Estimates) peaking above $105 in late 1999; it now trades at $13.
Then came the infrastructure stocks. Cisco Systems (CSCO: Research, Estimates), which makes routers and switches for the Internet, saw its shares top in April last year.
But fiber-optic stocks like JDS Uniphase �(JDSU: Research, Estimates) held up well through September, while data storage shares such as EMC Corp �(EMC: Research, Estimates) made it until the early part of winter before falling.
The Nasdaq's losses pale compared with some of its components. Yahoo! �(YHOO: Research, Estimates) stock is down 93 percent from its peak of $237.50 reached earlier last year.
Jeremy Siegel, a professor of finance at the Wharton School, sees the year-long sell-off as a rational response to fast-weakening corporate profits. And he says the worst may not be over. "I don't think (tech stocks) are cheap," Siegel said. "But they are closer to true value."
John Hancock's Klee is more upbeat. While Klee calls current fundamentals "dreadful," he sees tech stocks rising modestly later this year as the economy improves. His forecasts for a Nasdaq at 3,000 by year's end would give the index a 21 percent gain in 2001.
But that forecast still would mean a 26 percent drop over two years, a testament to last year's big losses.
It's only over three years that Klee's Nasdaq 3,000 forecast for the end of 2001 looks good: a 36 percent gain.
For students of market history, the loses and gains appear rational from afar.
"The market correctly saw that the economy was going to soften in the fourth quarter," Klee said.
But that's little comfort for the person who bought CMGI, the company with stakes in other Internet firms, at $163 a share early last year. CMGI �(CMGI: Research, Estimates) now trades at $4. 
|
|
|
|
|
 |

|