graphic
Markets & Stocks
Salomon turns bullish
April 3, 2001: 8:48 a.m. ET

Brokerage lifts equity weighting by 5%, says tech wreck is waning
graphic
graphic graphic
graphic
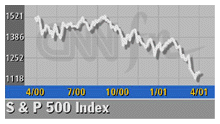
NEW YORK (CNNfn) - Salomon Smith Barney upped its equity weighting to 70 percent from 65 percent Tuesday in a research report saying much of the tech wreck seems to be in the past, but that anything more than a near-term rally in the sector is unlikely.

Reports of the market's demise would seem to be exaggerated, Salomon said, adding that global monetary and fiscal policy and the Fed's easing of interest rates should propel the market higher and bring financials to more of a leadership position.

graphicThe report also said traditional valuation metrics show that equities should perform better than bonds, although recent news of bond issuance seems similar to the equity boom a year ago.

Investors' risk aversion is apparent across many fronts, suggesting a bottom, the report said.

But Salomon also lowered its year-end S&P index target to 1,400 and its Dow Jones industrial average target to 11,400.

Separately, the brokerage added Wells Fargo (WFC: Research, Estimates) to its recommended List.  graphic


graphic

Most stock quote data provided by BATS. Market indices are shown in real time, except for the DJIA, which is delayed by two minutes. All times are ET. Disclaimer. Morningstar: © 2018 Morningstar, Inc. All Rights Reserved. Factset: FactSet Research Systems Inc. 2018. All rights reserved. Chicago Mercantile Association: Certain market data is the property of Chicago Mercantile Exchange Inc. and its licensors. All rights reserved. Dow Jones: The Dow Jones branded indices are proprietary to and are calculated, distributed and marketed by DJI Opco, a subsidiary of S&P Dow Jones Indices LLC and have been licensed for use to S&P Opco, LLC and CNN. Standard & Poor's and S&P are registered trademarks of Standard & Poor's Financial Services LLC and Dow Jones is a registered trademark of Dow Jones Trademark Holdings LLC. All content of the Dow Jones branded indices © S&P Dow Jones Indices LLC 2018 and/or its affiliates.

Most stock quote data provided by BATS. Market indices are shown in real time, except for the DJIA, which is delayed by two minutes. All times are ET. Disclaimer. Morningstar: © 2018 Morningstar, Inc. All Rights Reserved. Factset: FactSet Research Systems Inc. 2018. All rights reserved. Chicago Mercantile Association: Certain market data is the property of Chicago Mercantile Exchange Inc. and its licensors. All rights reserved. Dow Jones: The Dow Jones branded indices are proprietary to and are calculated, distributed and marketed by DJI Opco, a subsidiary of S&P Dow Jones Indices LLC and have been licensed for use to S&P Opco, LLC and CNN. Standard & Poor's and S&P are registered trademarks of Standard & Poor's Financial Services LLC and Dow Jones is a registered trademark of Dow Jones Trademark Holdings LLC. All content of the Dow Jones branded indices © S&P Dow Jones Indices LLC 2018 and/or its affiliates.