|
Schwab to cut more jobs
|
 |
August 15, 2001: 3:24 p.m. ET
Nation's top discount broker cites 36% drop in daily trading volume
|
NEW YORK (CNNfn) - Charles Schwab Corp. revealed Wednesday that it will cut more jobs as the nation's top discount broker grapples with a 36 percent drop in daily trading volume.
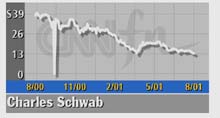
But it is too early to tell if the reductions will equal the considerable cuts Schwab made earlier this year, spokesman Glen Mathison said. San Francisco-based Schwab (SCH: up $0.10 to $13.38, Research, Estimates) had about 22,400 employees at the end of June, down nearly 15 percent from 26,300 at the end of last year.
"Given the prevailing environment, we are assessing the appropriate level of further restructuring initiatives, including reductions in our project and media spending, as well as our staffing and technology capacity," Schwab President and Co-CEO David S. Pottruck said Wednesday.
Summer traditionally is the worst time for discount brokers. For the first nine days of August, average revenue trades totaled only 112,000, Pottruck said.
Schwab, which already has instituted huge cost-cutting measures such as telling employees not to show up for work, plans to roll out its restructuring initiative in September and October, Mathison said.
However, the decline failed to affect Schwab shares which gained marginally in afternoon trading Wednesday.
The news came as Schwab said average daily client trades fell 36 percent to 173,100 in July. Average daily commission from trades totaled $124,200 during the month, down 43 percent from a year earlier. Total client assets fell by 9 percent in July to $851.3 billion.
The broker, which competes with rivals E*Trade Group Inc. (ET: down $0.20 to $5.78, Research, Estimates) and Ameritrade Holdings Corp. (AMTD: down $0.29 to $5.99, Research, Estimates), added $7.4 billion in net new assets during the month.
This year all the discount brokers have taken some tough defensive tactics to help them withstand the broad market slump � chopping staff, slashing ad budgets, and lopping off other extras.
"What we are seeing is more than a summer phenomenon but a worsening of investor sentiment," Mathison said. "People are continuing to be quite concerned about the state of economy and the markets. This is causing them to hold back their investing activity." 
|
|
|
|
|
 |

|