graphic
graphic  
graphic
News > Technology
graphic
Juniper beats the Street
graphic October 11, 2001: 5:02 p.m. ET

Network-equipment maker tops analysts' estimates by 3 cents per share.
graphic
graphic graphic
graphic
NEW YORK (CNNmoney) - Juniper Networks on Thursday logged a third-quarter operating profit that beat the Street's estimates on sales that were essentially flat with the same period last year.

After the close of trading, the data-networking equipment maker said it earned $32.5 million, or 10 cents per share, during the quarter. That excludes the amortization of goodwill and other one-time charges and compares with an operating profit of $60.3 million, or 17 cents per share, for the third quarter of 2000.

The Street generally had expected Juniper (JNPR: Research, Estimates) to log an operating profit of 7 cents per share, according to a survey conducted by earnings tracker First Call.

graphic  
Including one-time items, Juniper reported a third-quarter net loss of $29.7 million or 9 cents per share, compared with a net profit of $58.1 million, or17 cents per share, in the third quarter of 2000.

At $201.7 million, Juniper's third-quarter revenue was little changed from the $201.2 million it recorded for the same period last year. Analysts revenue expectations had been nearer $187.9 million, according to the First Call survey.

In addition, Juniper said its board of directors has authorized a stock repurchase program of up to $200 million during the next two years, effective immediately.

The company did not set financial expectations for the fourth quarter in its earnings release. They are expected to do so during a teleconference with analysts later Thursday evening.

The most recent consensus estimate of analysts polled by First Call is for a fourth-quarter profit of 8 cents per share on revenue of roughly $193 million.

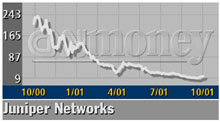
After rising $1.64 to $16.64 on Nasdaq ahead of the earnings release, Juniper shares soared to $20.25 in extended hours trade. graphic


graphic graphic

Most stock quote data provided by BATS. Market indices are shown in real time, except for the DJIA, which is delayed by two minutes. All times are ET. Disclaimer. Morningstar: © 2018 Morningstar, Inc. All Rights Reserved. Factset: FactSet Research Systems Inc. 2018. All rights reserved. Chicago Mercantile Association: Certain market data is the property of Chicago Mercantile Exchange Inc. and its licensors. All rights reserved. Dow Jones: The Dow Jones branded indices are proprietary to and are calculated, distributed and marketed by DJI Opco, a subsidiary of S&P Dow Jones Indices LLC and have been licensed for use to S&P Opco, LLC and CNN. Standard & Poor's and S&P are registered trademarks of Standard & Poor's Financial Services LLC and Dow Jones is a registered trademark of Dow Jones Trademark Holdings LLC. All content of the Dow Jones branded indices © S&P Dow Jones Indices LLC 2018 and/or its affiliates.

Most stock quote data provided by BATS. Market indices are shown in real time, except for the DJIA, which is delayed by two minutes. All times are ET. Disclaimer. Morningstar: © 2018 Morningstar, Inc. All Rights Reserved. Factset: FactSet Research Systems Inc. 2018. All rights reserved. Chicago Mercantile Association: Certain market data is the property of Chicago Mercantile Exchange Inc. and its licensors. All rights reserved. Dow Jones: The Dow Jones branded indices are proprietary to and are calculated, distributed and marketed by DJI Opco, a subsidiary of S&P Dow Jones Indices LLC and have been licensed for use to S&P Opco, LLC and CNN. Standard & Poor's and S&P are registered trademarks of Standard & Poor's Financial Services LLC and Dow Jones is a registered trademark of Dow Jones Trademark Holdings LLC. All content of the Dow Jones branded indices © S&P Dow Jones Indices LLC 2018 and/or its affiliates.

graphic