|
Wall St.: From bad to worse
|
 |
December 17, 2001: 2:11 p.m. ET
U.S. stocks extend slide to second year for first time since 1974.
By Staff Writer Jake Ulick
|
NEW YORK (CNN/Money) - They began the year bruised, they end the year battered. And now, U.S. stock investors hope 2002 won't bring the first three-year stretch of falling prices since 1941.
Barring a ferocious rally, the major market indexes will drop for a second straight year in 2001 -- a year when corporations saw their worst profit performance in a decade, a record-long economic expansion ended, and terrorists attacked the nation's financial center.
"Everything has lost money," said Judith Segal, an individual investor from East Hampton, N.Y., who estimates her retirement fund has shed half its value in the last two years.
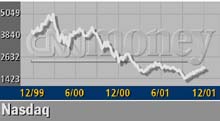
If last year was bad, this year was worse. Stock prices fell to three-year lows in 2001, wiping out all the gains from the Nasdaq composite index's 85 percent run in 1999.
This year, the losses spread beyond technology stocks. After falling 6.2 percent in 2000, the Dow Jones industrial average was down 9.4 percent this year through Friday.
It wasn't supposed to be this way. Prospects for tumbling interest rates caused analysts to forecast rising stocks this year. Interest rates fell. But so did stocks.
For all the losses, 2001 was also a year of head fakes. Three of the Nasdaq's four best one-day gains happened in 2001, a year when the index fell 21.2 percent through Friday.
"It's been a tough year and it's been an extremely volatile year," said Michael Cohen, whose Alpha Analytics Digital Future Fund is down about 47 percent in 2001.
The losses took Wall Street's top strategists by surprise. Forecasters at Goldman Sachs, Lehman Brothers, Merrill Lynch and elsewhere all incorrectly predicted double-digit gains.
Unbowed, most have renewed their optimistic forecasts for next year, with Ed Kerschner, chief global strategist at UBS Warburg, among the most bullish.
He forecasts that the Standard & Poor's 500 will rise to 1,570 by the end of next year, a 40 percent gain from Friday's levels.
Kerschner expects the market will look beyond current profit weakness to a time of growth in the second half of next year. He expects earnings among S&P 500 companies to jump 13.3 percent in 2002.
He's not alone. While profits at the nation's largest companies are expected to fall 15.9 percent this year, according to research firm First Call -- their worst performance since 1991 - next year's projections call for a rebound. Analysts expect a 15.5 percent jump in earnings, according to First Call's consensus forecast.
U.S. equity strategist Douglas Cliggott of J.P. Morgan may be worth listening to. Cliggott was bearish last year. And he's bearish going forward, expecting the S&P 500 to fall to 950 by the end of 2002.
Stocks, he said, are still expensive, with the S&P 500 trading 31 times his estimate for this year's profits.
"We think this is an opportune time for investors to reduce exposure to U.S. equities," Cliggott wrote in his latest note to clients. He advises keeping stocks to 50 percent of investments, with the rest split evenly between bonds and cash.
Ups amid the downs
The year began with a bang. The Nasdaq surged a record 14.17 percent on the second trading day of 2001 after the Federal Reserve surprised investors with a half-percentage point rate cut. That was the first of 11 attempts by central bankers to revive consumer and business spending.
Stocks continued to rise in January only to tumble by April. They gained sharply through May before gradually declining through summer.
And then came Sept. 11. The Dow industrials fell more than 1,300 points in the first week after the markets reopened following the terror attacks, its worst week since the Great Depression.
By Sept. 21, the major indexes had fallen to three-year lows. But less than 10 weeks later, the major indexes erased their post-Sept. 11 losses, vindicating investors who called for patriotic buying after the attack.
But even with the autumn rally, the market's first two-year decline since 1974 is all but assured. The Nasdaq needs to rise 26.7 percent to go positive for the year; the Dow requires a 10.4 percent gain.
The stock market's bust requires a look back at its boom. The rise of the Internet drew an unprecedented amount of money into fast-growing technology companies, some of which never showed a profit. Businesses, meanwhile, poured millions of dollars into computing systems, storage and communications networks. Demand for new workers pushed the unemployment rate to a 30-year low of 3.9 percent last year.
As the cycle peaked, businesses cut spending and orders for manufactured goods fell. Economies in Asia and Europe weakened. A strong dollar made it tough to sell goods abroad. Some say the Federal Reserve hiked interest rates too much last year. Others say central bankers didn't cut rates soon enough.
But a consensus is emerging that last year's fast retreat of capital from the technology sector rippled throughout the economy this year in surprising ways.
"The sudden withdrawal created a shock to our economy," said Alpha Analytics' Cohen.
For its part, the public turned away. If investors watched their paper wealth evaporate last year, this year many couldn't bear to look.
Blame some unusual distractions.
Stocks momentarily fell this autumn amid fears that the number of anthrax cases would escalate. That hasn't happened. Investors also recoiled on Nov. 12 when an American Airlines plane bound for the Dominican Republic crashed near John F. Kennedy Airport in New York. But the crash, considered an accident, proved isolated.
And the defeat of Afghanistan's Taliban, which harbors terrorist suspect Osama bin Laden, has helped stocks this fall.
With the mix of uncertainty, some don't even bother with forecasts.
"It's a losers' game to try and guess, it really is," said Mike Farrell, a quantitative analyst at David L. Babson, who thinks the over-investment of the late 1990s may see more unwinding next year. Consumers, he said, have not yet to pull back substantially on spending.�
Farrell likes companies with little or no debt such as computer systems developer Unisys (UIS: Research, Estimates) , PC maker Gateway (GTW: Research, Estimates) and communications equipment maker Scientific-Atlanta (SFA: Research, Estimates).
The year's worst performing sector, according to Standard & Poor's, was computer makers, which tumbled 71.3 percent as the industry endured sluggish sales. Independent power producers declined 71.1 percent.
The year also witnessed a historic corporate implosion. From a more than $90 price in August 2000, Enron (ENE: Research, Estimates) �shares tumbled 99 percent as the bankrupt energy trader suffered from crushing debt and dubious accounting.
But specialty retail stocks rose more than 50 percent this year, with general retailers not far behind. Shares of Sears (S: Research, Estimates) are up more than 30 percent this year.
And the nation's second-most valuable company, software maker Microsoft (MSFT: Research, Estimates), has gained 53 percent in 2001.
But most sectors, from autos to airlines, health care to energy, fell during a period when the record-long economic expansion came to an end. The economy shrank 1.1 percent in the third quarter, its worst performance since the first quarter of 1991.
An arbiter of recessions, the National Bureau of Economic Research, said the economy entered recession in March. More and more Americans lost their jobs. The unemployment rate rose to a six-year high of 5.7 percent in November as employers eliminated 331,000 jobs.
But while stocks fell this year, bonds had another good run. The largest fixed-income fund, Pimco's Total Return Bond Fund, rose 8.1 percent this year through Thursday.
The bond market, by sending yields higher in the past month, is betting on economic recovery next year, foreseeing a time of rising inflation and higher interest rates.
Before then, 2001 will be compared to the last time stocks fell for two straight years. In 1974, Richard Nixon resigned as president and the United States faced an energy crisis. By contrast, President Bush enjoys record popularity. Energy prices are low.
But investors looking for historical parallels can take heart in this: The next year, 1975, was a great year for stocks, which seven years later, in 1982, began a nearly uninterrupted 20-year run.
Over time, the stock market has retuned about 9 percent a year.
"I expect we will be seeing those kind of normative gains next year," said Douglas Altabef, managing director of Matrix Asset Advisors.
But for Judith Segal, the individual investor from East Hampton, stock market losses don't seem so important after Sept. 11, an attack that took the lives of people she knew.
"You have to remember it's just money," Segal said. 
Click here to send mail to Jake Ulick
|
|
|
|
|
|

|