|
Fresh data pressure bonds
|
 |
January 4, 2002: 3:14 p.m. ET
U.S. Treasurys pull back after two key economic reports hint at improvement.
|
NEW YORK (CNN/Money) - U.S. Treasurys retreated Friday as fresh data on the U.S. labor market and on the service sector of the economy suggested that the nation may be poised to emerge from recession.
At 2:45 p.m. ET, two-year notes were down 2/32 at 100-3/32, yielding 3.19 percent. Five-year notes were down 6/32 at 95-25/32, yielding 4.48 percent.
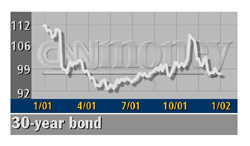
Benchmark 10-year notes were down 14/32 at 98-24/32, yielding 5.17 percent. Thirty-year bonds were down 20/32 at 97-3/32, yielding 5.58 percent.
"The big influence on bonds is stocks' ability to move higher," said William Sullivan, executive director of money market research at Morgan Stanley.
"The stock market sees these data as representing an end to the recessionary environment and signaling some improvement in the not-too-distant future. For now, the dominant view is that this is the close on the 2001 recession, so you sell bonds to buy stocks."
The U.S. unemployment rate rose to 5.8 percent in December, but the number of job cuts slacked off, pointing to a possible stabilization in the labor market of the world's largest economy. The Labor Department said employers cut 124,000 jobs from non-farm payrolls last month after a revised loss of 371,000 jobs in November. It was the smallest drop in payrolls since August. The unemployment rate rose from a revised 5.6 percent.
Investors took a keen interest in the data, seeking clues to future economic performance and Fed monetary policy. The Fed has cut its benchmark federal funds rate 11 times -- a total of 4.75 percentage points -- to 1.75 percent since the start of 2001; Fed policy makers meet again at the end of January.
Bonds fell further after the Institute for Supply Management (formerly NAPM) reported that its December non-manufacturing business index rose further above the 50 mark to 54.2 in December from November's reading of 51.3. The new orders index also rose, to 52.6. A reading above 50 points to expansion; a reading below 50 signals contraction.
"The index suggested that the healing process in the economy is coming on much more quickly than envisioned," said Sullivan.
"Today the collective wisdom is that the economy will improve in the not-too-distant future, and that's hostile for bonds because it suggests that the Fed is done easing monetary policy and that financial markets may confront some interest-rate pressures as the economy improves and borrowing re-accelerates," Sullivan said.
Though their reports did not help the bond market, two private research groups said inflation, anathema to the bond market because it erodes the value of fixed-income investments, remained subdued.
The Economic Cycle Research Institute (ECRI) said a rise in real estate loans and a decline in industrial price growth helped push its inflation index slightly higher to 95.3 in December from an upwardly revised reading of 95.2 in November, but that the index remained near a 26-year low.
And the Foundation for International Business and Economic Research (FIBER) said its U.S. leading inflation index fell to 88.7 in December from an upwardly revised 88.8 in November.
Dollar advances against euro, pulls back versus yen
In the currency market, news of the slowing pace of U.S. job losses in December helped to halt the dollar's slide against the yen Friday and keep it higher against the euro, currency analysts said.
"The better-than-expected unemployment number stalled out the overnight correction in the dollar/yen trend," said Tod van Name, foreign exchange manager at Fuji Bank.
At 2:45 p.m. ET, the euro was quoted at 89.54 U.S. cents, down from 89.91 U.S. cents late Thursday.
The dollar bought ¥130.92, down from ¥131.81 late Thursday. 
--from staff and wire reports
|
|
|
|
|
|

|