NEW YORK (CNN/Money) - U.S. stocks edged high enough Tuesday to snap the Dow Jones industrial average's six-session losing streak in a day gripped by worries over upcoming quarterly financial results.
The volatile session saw a morning rally disappear by mid-afternoon. But the major indexes forged slight gains by the close.
Still, the stock market has made no real progress in 2002, as investors fret the business outlook will not brighten enough to sustain 2001's year-end rally.
"People don't think that earnings going forward will be able to substantiate the gains we've had in the market place," Patrick Boyle, head financial trader at Credit Suisse First Boston, told CNNfn's Street Sweep.
Intel, which after the closing bell posted an operating profit that fell to 15 cents share, has seen its shares jump 84 percent since Sept. 21.
Intel's results, which topped forecasts, come during a week when some of the nation's biggest companies roll out results for the December quarter -- a tough period for most businesses.
"I hope some of them [reporting results] will say at least things are getting better," said Charles Payne, head analyst at Wall Street Strategies.
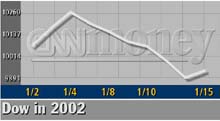
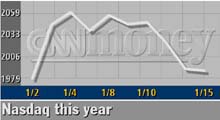
The Dow industrials rose 32.73 points, or 0.3 percent, to 9,924.15, its first gain since Jan 4. The Nasdaq snapped a two-day losing streak, rising 10.17, or 0.5 percent, to 2,000.91. The Standard & Poor's 500 index rose 7.78 to 1,146.19.
Tuesday's gains narrowed the Dow's 2002 loss to 1 percent. The Nasdaq is up 2.6 percent on the year while the S&P 500, a broader index, is down 0.2 percent.
More stocks rose than fell. On the New York Stock Exchange, advancing stocks topped declining ones 9-to-6 as 1.3 billion shares traded. Nasdaq winners edged losers 9-to-8 as 1.6 billion shares traded.
In other markets, the dollar jumped against the euro but edged lower versus the yen. Treasury securities advanced.
Blue chips mixed
Eighteen of the 30 Dow stocks rose, including American Express (AXP: up $1.50 to $37.75, Research, Estimates), Wal-Mart Stores (WMT: up $1.11 to $56.87, Research, Estimates) and Procter & Gamble (PG: up $0.95 to $79.65, Research, Estimates) .
But the losses in Intel (INTC: down $0.16 to $34.68, Research, Estimates) , United Technologies (UTX: down $1.12 to $61.12, Research, Estimates) and 3M (MMM: down $2.26 to $109.50, Research, Estimates) limited the gains.
Declines in Sun Microsystems (SUNW: down $0.53 to $12.53, Research, Estimates) weighed on the Nasdaq. Credit Suisse First Boston widened its forecast of how much money Sun lost in the fourth quarter.
The most actively traded stock on the New York Stock Exchange, Tyco International (TYC: down $4.35 to $48.05, Research, Estimates), cut its profit target for the current quarter after the diversified manufacturer posted a rising profit for its fiscal first quarter.
The staggering losses continued for Kmart (KM: down $0.39 to $2.45, Research, Estimates), the retailer whose stock has fallen more than 50 percent this year amid worries about it financial health.
Among other losers, Dollar General (DG: down $2.06 to $14.03, Research, Estimates), another discount retailer, restated its profits lower.
In the latest setback for Enron (ENE: Research, Estimates), the NYSE moved to delist the bankrupt energy company, whose shares have not traded since Friday when they closed at 67 cents.
NYSE's biggest gainer, airline America West (AWA: up $0.76 to $3.91, Research, Estimates), was upgraded by Goldman Sachs to "market outperform" from "market perform."
Also advancing, No. 4 U.S. bank Wells Fargo (WFC: up $2.30 to $45.32, Research, Estimates), said it earned a record net profit of 69 cents a share in the fourth quarter as lower interest rates drove growth in the mortgage lending business.
Waiting for results
This week is a busy one for companies releasing December quarter results which, on average, are expected to fall for a fourth straight quarter as the United States suffers through its first recession in a decade.
Joining Intel after the bell, eBay (EBEY: Research, Estimates) , the online auctioneer said profits rose to 14 cents a share, topping forecasts.
IBM, Microsoft, Citigroup and General Motors are among the other companies rolling out quarterly profits this week.
After falling to three-year lows in mid-September, stocks rallied in the final three months of 2001 as investors bet on better economic times ahead.
Still, Wall Street Strategies' Payne is not convinced that the business outlook will be upbeat enough to sustain the market's big run.
"Everyone's still a little nervous about valuations," said Payne, who nonetheless was encouraged by the latest retail sales figures showing that the holiday shopping season was not as bad as feared.
Retail sales fell a much smaller-then-expected 0.1 percent last month, the government said. Excluding auto sales, sales also fell 0.1 percent in December.
Rising unemployment does not appear to have derailed spending by consumers, who are enjoying lower energy prices and interest rates. But Federal Reserve Chairman Alan Greenspan said last week that the economy, though stabilizing, remains weak.
For some economists, Greenspan's comments raised the likelihood of another interest rate cut when Fed policy makers meet in two weeks. U.S. central bankers lowered short-term borrowing costs 11 times last year. 
Click here to send mail to Jake Ulick
|