graphic
graphic  
graphic
News > Companies  
graphic
Heinz profit declines
Ketchup maker posts sales increase as it meets EPS forecasts; confirms 4Q outlook.
March 14, 2002: 11:28 AM EST

NEW YORK (CNN/Money) - H.J. Heinz Co. posted a drop in fiscal third-quarter profit despite improved sales, but the foodmaker still met Wall Street expectations and said it is on target to meet fourth-quarter forecasts.

Pittsburgh-based Heinz earned net income of $201.7 million, or 57 cents a share, in the period ended Jan. 31. That's in line with the consensus analyst estimate of earnings tracker First Call, but down from the $227.4 million, or 65 cents a share, it earned before special items in the year-earlier period.

graphic
graphic graphic
graphic
The company blamed the lower profit on higher selling, general and administrative expenses due to the effects of acquisitions and with a change in product mix. Operating income fell in its core Heinz North America unit and in Asia, while it improved in its pet products, seafood and North American frozen food operations, as well as in Europe.
Sales increased 12 percent to $2.6 billion from $2.3 billion a year earlier, which topped First Call forecasts of $2.5 billion for the latest period.

Sales of ketchup, condiments and sauces, its largest division, rose 12 percent, while frozen food sales posted a 23 percent sales gain and convenience food sales climbed 27 percent. Seafood sales were up marginally, while sales of infant and nutritional foods and pet products declined.

  graphic  Related stories  
  
Heinz warns
Heinz hits 1Q, warns
  

Heinz said that it should meet earlier guidance for full fiscal-year profit. First Call forecasts fiscal fourth-quarter earnings per share should rise to 62 cents from 53 cents a year ago.

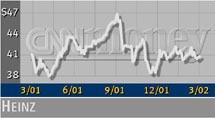
Shares of Heinz (HNZ: Research, Estimates) lost 28 cents to $40.54 in trading Wednesday.  graphic


graphic

Most stock quote data provided by BATS. Market indices are shown in real time, except for the DJIA, which is delayed by two minutes. All times are ET. Disclaimer. Morningstar: © 2018 Morningstar, Inc. All Rights Reserved. Factset: FactSet Research Systems Inc. 2018. All rights reserved. Chicago Mercantile Association: Certain market data is the property of Chicago Mercantile Exchange Inc. and its licensors. All rights reserved. Dow Jones: The Dow Jones branded indices are proprietary to and are calculated, distributed and marketed by DJI Opco, a subsidiary of S&P Dow Jones Indices LLC and have been licensed for use to S&P Opco, LLC and CNN. Standard & Poor's and S&P are registered trademarks of Standard & Poor's Financial Services LLC and Dow Jones is a registered trademark of Dow Jones Trademark Holdings LLC. All content of the Dow Jones branded indices © S&P Dow Jones Indices LLC 2018 and/or its affiliates.

Most stock quote data provided by BATS. Market indices are shown in real time, except for the DJIA, which is delayed by two minutes. All times are ET. Disclaimer. Morningstar: © 2018 Morningstar, Inc. All Rights Reserved. Factset: FactSet Research Systems Inc. 2018. All rights reserved. Chicago Mercantile Association: Certain market data is the property of Chicago Mercantile Exchange Inc. and its licensors. All rights reserved. Dow Jones: The Dow Jones branded indices are proprietary to and are calculated, distributed and marketed by DJI Opco, a subsidiary of S&P Dow Jones Indices LLC and have been licensed for use to S&P Opco, LLC and CNN. Standard & Poor's and S&P are registered trademarks of Standard & Poor's Financial Services LLC and Dow Jones is a registered trademark of Dow Jones Trademark Holdings LLC. All content of the Dow Jones branded indices © S&P Dow Jones Indices LLC 2018 and/or its affiliates.