
graphic
graphic  
graphic
News > Companies  
graphic
P&G guides higher for 3Q
Consumer products maker sees double-digit earnings growth; expects to top 81 cents a share.
March 19, 2002: 10:55 AM EST

NEW YORK (CNN/Money) - Procter & Gamble Co. said Tuesday that it expects third-quarter earnings to post double-digit growth and exceed analysts' estimates of 81 cents a share due to strong volume and cost reductions.

Cincinnati-based P&G, which makes Pampers diapers, Tide detergent, Folgers coffee and other consumer products, also said it sees third-quarter sales growth, excluding the effect of currency exchange, in the high-single digits. The company said monetary exchange will hurt its top line by about 3 percent due to weakness in the euro, yen and Argentine peso.

graphic
graphic graphic
graphic
"We are pleased that we are delivering increased top and bottom line growth," said Procter & Gamble's president and chief executive, A.G. Lafley. "While we still have more to do, we feel good about P&G's progress."

The company expects third-quarter volume growth of 9-to-10 percent due to its Clairol acquisition from Bristol-Myers (BMY: Research, Estimates) and performance of its health care and home care product lines.
In addition, P&G said it expects core earnings in fiscal year 2002 to grow at a rate higher than the prior year, but short of its long-term growth target of double digits. The company also sees sales growth in 2002, excluding currency exchange, higher than last year's rate, but shy of its long-term target of 4-to-6 percent.

The 2002 estimates include the impact of the company's sale of its Jif and Crisco brands to J.R. Smucker Co. (SJM: Research, Estimates), which P&G said will dilute earnings per share in the fourth quarter.

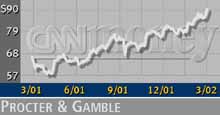
Procter & Gamble said it is comfortable with its previous guidance for fiscal year 2002. Wall Street expects Procter & Gamble (PG: up $1.53 to $89.19, Research, Estimates) to earn $3.51 a share in 2002, according to research firm First Call.  Top of page


graphic

Most stock quote data provided by BATS. Market indices are shown in real time, except for the DJIA, which is delayed by two minutes. All times are ET. Disclaimer. Morningstar: © 2018 Morningstar, Inc. All Rights Reserved. Factset: FactSet Research Systems Inc. 2018. All rights reserved. Chicago Mercantile Association: Certain market data is the property of Chicago Mercantile Exchange Inc. and its licensors. All rights reserved. Dow Jones: The Dow Jones branded indices are proprietary to and are calculated, distributed and marketed by DJI Opco, a subsidiary of S&P Dow Jones Indices LLC and have been licensed for use to S&P Opco, LLC and CNN. Standard & Poor's and S&P are registered trademarks of Standard & Poor's Financial Services LLC and Dow Jones is a registered trademark of Dow Jones Trademark Holdings LLC. All content of the Dow Jones branded indices © S&P Dow Jones Indices LLC 2018 and/or its affiliates.

Most stock quote data provided by BATS. Market indices are shown in real time, except for the DJIA, which is delayed by two minutes. All times are ET. Disclaimer. Morningstar: © 2018 Morningstar, Inc. All Rights Reserved. Factset: FactSet Research Systems Inc. 2018. All rights reserved. Chicago Mercantile Association: Certain market data is the property of Chicago Mercantile Exchange Inc. and its licensors. All rights reserved. Dow Jones: The Dow Jones branded indices are proprietary to and are calculated, distributed and marketed by DJI Opco, a subsidiary of S&P Dow Jones Indices LLC and have been licensed for use to S&P Opco, LLC and CNN. Standard & Poor's and S&P are registered trademarks of Standard & Poor's Financial Services LLC and Dow Jones is a registered trademark of Dow Jones Trademark Holdings LLC. All content of the Dow Jones branded indices © S&P Dow Jones Indices LLC 2018 and/or its affiliates.