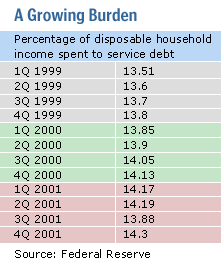
NEW YORK (CNN/Money) - U.S. consumers are spending more of their money to service debt than at any time in 15 years, and a recent study pointed out that such high levels usually foretell a slowdown in consumer spending, the lifeblood of the world's largest economy.
The Federal Reserve, the nation's central bank, recently said U.S. households spent 14.3 percent of their disposable income to pay down debts, such as credit card balances and mortgages, in the fourth quarter of 2001. It was the highest level since 14.4 percent in the fourth quarter of 1986 and the second-highest level since the Fed started keeping track in 1980.
Anthony Chan, chief economist at Banc One Investment Advisors, released a study Tuesday showing that debt-service levels at the end of the latest U.S. recession, which likely began in March 2001, are much higher than they were at the end of the previous two recessions.
The debt-service ratio was 12.8 percent at the end of the 1980 recession, 12.5 percent at the end of the 1982 recession and 13.3 percent at the end of the 1991 recession.

And the ratio declined in the last six months of each of those recessions, Chan noted, while the debt actually rose in the last six months of 2001.
"Based on these trends, it is not too difficult to conclude that the average consumer is probably a bit overextended from a credit standpoint," Chan said.
He also noted that previous peaks of debt-service levels have been followed by dramatic slowdowns in consumer spending. When the debt-service ratio peaked in 1986, for example, consumer spending was rising by 4.5 percent from the year before. A year later, the pace of growth had slowed to 2.7 percent.
"Our analysis suggests the pace of consumer spending is likely to slow in the near-term future," Chan said.
Consumer spending is of particular interest to economists because it is the backbone of the U.S. economy, making up more than $6 trillion of the $9 trillion U.S. gross domestic product (GDP) in 2001.
| |
 Related links
| |
| | |
| | |
|
Driven by 11 Fed interest-rate cuts and aggressive incentives -- zero-percent financing offered by automakers being the most famous example -- consumer spending bounced back from the Sept. 11 terror attacks, a recession and more than a million job cuts.
The robust spending helped GDP grow in the fourth quarter after shrinking in the third, helping the economy avoid two straight quarters of shrinking GDP, the common definition of a recession.
But many economists worried then that the spending could steal growth from future quarters, and Banc One's study seems to reinforce that notion.
"This would provide another pillar of support for the view that the economic recovery in the year ahead is likely to be gradual," Chan said.

|

