NEW YORK (CNN/Money) -
As if investors didn't have enough to worry about, a brokerage house has invented a new measure to show that the corporate profit recovery could take longer than the market and some analysts think.
A key economic measure in the last decades of the 20th century was the "misery index," which combined inflation and unemployment to show how badly consumers were hurting. But the key gauge for the first decade of the new century could be something called the "corporate misery index."
The corporate misery index, as coined by Merrill Lynch, takes consumer inflation growth and subtracts wage growth to come up with a measure of profit margin change. Then it adds a measure of goods and services sold by companies, and the combination -- units sold and profit margin per unit -- reveals the likely direction of corporate profits.
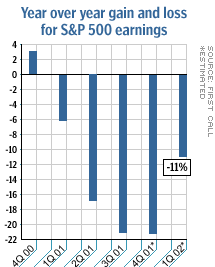
And profits, not surprisingly, have been pretty miserable lately. The misery index has fallen consistently since the end of 2000, and corporate profits have dropped along with it. In fact, the dip in profits in the last two quarters of 2001 was the worst for companies in the S&P 500 index in the post-World War Two period, according to Merrill Lynch.

And, while the index has risen lately, it hasn't been enough to indicate that a stirring recovery in corporate profitability is on the horizon.
"At the rate it's going right now, profitability will accelerate, but at a very, very slow pace," said Richard Bernstein, Merrill's chief U.S. strategist, "much slower than what's implied by valuation in the market."
The index takes the percent change in the consumer price index (CPI), a key measure of consumer inflation, and subtracts the percent change in average hourly earnings for workers. The result is a measure of the growth of corporate profit margins, since companies benefit from higher prices, but suffer when wages rise.
To complete the misery index, Merrill Lynch adds the percent change in the coincident economic index of the Conference Board, a private research firm. The coincident index combines industrial production, personal income, manufacturing and trade sales, and non-farm payrolls and is a stand-in for real gross domestic product (GDP), or the goods and services sold by companies, according to Merrill Lynch.
Got all that?
It's certainly obscure, but Merrill Lynch pointed out that it has done a pretty good job of predicting the direction of corporate profit growth in the past 30 years.
Corporate suffering began in 2000, when companies abruptly stopped spending on factory improvements and new technology. An 18-month manufacturing recession followed, fueling a slowdown in the broader economy that included more than a million job cuts.
Ironically, the "productivity miracle" of the 1990s, which allowed companies to make goods more cheaply, kept prices low and consumers happy, but hurt corporate profits during the latest downturn, Bernstein said.
On the other hand, when corporate profits start to recover, partially as a result of higher prices and job cuts, it could be at the expense of the consumer.
| |
 Related links
| |
| | |
| | |
|
While inflation and unemployment are still laughable compared with what they were in the mid-70s, even slight changes in those measures this year will cool off consumer spending, which made up two-thirds of U.S. GDP in 2001.
The result could be a double headache of sluggish profit growth and consumer spending -- still a recovery, but an anemic one.
As a result, Bernstein recommended investors focus on "high quality" stock sectors such as utilities, consumer staples, energy, drugs and industrials. He also recommended avoiding technology and telecommunications stocks.

|

