NEW YORK -
Market losses and a changing mood among investors have shaken up the top 20 mutual funds in 401(k) plans.
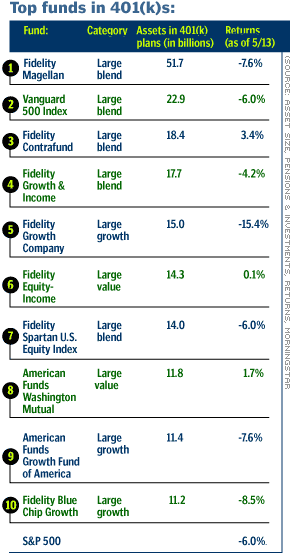
Once dominated by high-flying growth funds, the list of funds with the most 401(k) assets is much tamer -- and considerably smaller -- than it was a year ago, according to Pensions & Investments, a magazine that tracks retirement plan investments. (See table below for the full list, and click here for regular performance updates.)
Overall, combined assets in the 20 funds shrank 21.6 percent to $264.6 billion for the 12 months ending Dec. 31, 2001. Fidelity Magellan remains at the top of the list, with $51.7 billion in 401(k) plans (down from $59.7 billion last year.) Ranked second is Vanguard 500 Index, with $22.9 billion in assets, (down from $25 billion last year.)
Four riskier growth funds, including Putnam New Opportunities, fell out of the top 20. And more conservative value funds continued their strong showing. One, Vanguard Windsor II, made it into the top 20 for the first time (at No. 15), and small-cap value fund Fidelity Low-Priced Stock debuted at No. 20.
Joel Dixon, a principal in the portfolio review group at Vanguard, said the changes in the list reflect the performance of various asset classes on Wall Street. Since the bear market began in 2000, value has trumped growth. As a result, investors funneled $34.7 billion into value funds in 2001, compared to an outflow in 2000 of 17.6 billion, according to Morningstar. Growth funds had outflows of $900 million in 2001, after taking in $86.7 billion in 2000.
"[The list] reflects what investors are demanding," said Don Dion, president of Dion Money Management in Williamstown, Mass. "They want value funds, they want small caps."
It wasn't too long ago that growth dominated the list of the largest 401(k) funds. In the year ending Dec. 31, 1999, for example, there were nine growth funds. Now, there are just five, including Putnam Voyager, ranked 19 with $6 billion in assets. The fund had been ranked 12 in the previous year, with $10.8 billion in assets.

Eric Wetlaufer, one of 13 managers on the team at Putnam Voyager, recalled that back in the bull market, people had pretty much written off asset allocation. Financial planners used to say that large growth was the way to go.
"We were it," Wetlaufer joked. "You had such a huge disparities in performance between asset classes, that investors felt extraordinary pain if they weren't all in growth. You felt stupid that you were missing the train."
Now, however, all of that is different. Wetlaufer said the fund is tweaking its strategy, looking at slightly smaller companies that are a little further out on the growth spectrum. It also owns companies that will probably be in the portfolio for years, "foundation stocks," such as Citigroup. It also owns a former favorite of value funds that has turned into a growth stock -- Philip Morris.
How the funds are faring this year
So how are the funds doing lately? Magellan is having its worst year in manager Bob Stansky's tenure, in part due to his bet on struggling Tyco, according to Russ Kinnel, an analyst at Morningstar. Other top holdings, including GE and AIG, are also suffering. The fund is down 7.6 percent as of May 13, compared to a loss of 6 percent for the S&P 500.
But other Fidelity funds are having better results, mainly because they lightened up on technology. Fidelity Contrafund, Growth & Income and Equity-Income are all outperforming the S&P 500.
Vanguard Windsor is struggling at the bottom of its category, down 3.1 percent, because of stakes earlier this year in Adelphia Communications and WorldCom, Morningstar said. Both stocks have collapsed. Windsor II is up 2.3 percent this year and is in the top quarter of the large value category.
On the growth side, Janus is down 4.7 percent this year but is in the top quarter of its category. Its top ten holdings include Tenet Healthcare and Bank of New York, both trading near their 52-week highs, as well as some names that are struggling, including CNN/Money parent AOL Time Warner and Tyco. The fund group has lightened up considerably on AOL Time Warner and Nokia, according to a recent filing. (Click here for more on Janus's move out of the two stocks, and click here for more on how the fund family has been doing amid the downturn.)
Putnam Voyager, meanwhile, is down 6.2 percent, which puts it in the top third of its category.
| |
 Related stories:
| |
| | |
| | |
|
While growth continues to lag value, investors might be experiencing a case of deja vu. But back in the bull market, it was value that remained out in the cold.
Kinnel's biggest fear is that investors will repeat the same mistake, by loading up on the latest winner. That, he said, is a recipe for disaster. The best way to weather the growth-value tilt is to keep some of your money in both. The peaks won't be as high, but neither will the valleys.

|

