graphic
graphic  
graphic
News > Technology
graphic
Applied Materials beats Street
Chip equipment maker edged second-quarter earnings expectations by a penny.
May 14, 2002: 5:43 PM EDT

NEW YORK (CNN/Money) - Chip equipment maker Applied Materials beat second-quarter earnings and revenue expectations Tuesday, while new orders for the company also came in above forecasts.

"I think we can clearly see that we're in the first phase of a recovery," Jim Morgan, Applied Materials chairman and CEO, told investors in a conference call. "The recovery is being driven by consumer demand."

graphic
graphic graphic
graphic
For the second quarter of fiscal 2002, Applied Materials (AMAT: Research, Estimates) reported net income of $52 million, or 3 cents per share, compared to $318 million, or 19 cents per share, in the year-ago period.

The technology bellwether said excluding one-time items it also earned 3 cents per share, compared to the 21 cents per share it earned in the same quarter a year ago.

Sales dropped 46 percent from the second quarter of 2001 to $1.16 billion. But that number is up 16 percent from sales in the fiscal year's first quarter.

Analysts surveyed by First Call were expecting the company to earn 2 cents per share with sales of $1.04 billion.

New orders, which were expected to fall from the year-ago period, actually jumped 25 percent to $1.69 billion. They were also up 51 percent from the $1.12 billion in new orders Applied Materials recorded in the first quarter of fiscal 2002.

"Bookings were up more than 50 percent as business momentum picked up strongly over the quarter," Morgan said.
But he added while there has been a moderate recovery in the semiconductor industry the environment for electronics overall is still mixed.

Looking ahead, Applied Materials says it expects earnings per share to rise in the third quarter mainly due to revenue which is expected to rise to $1.2 billion to $1.3 billion.

That would be roughly in line with First Call's current estimates of earnings of 4 cents per share and sales of $1.2 billion.

Third-quarter new orders are expected to rise 10 to 15 percent from the second quarter, which would put them in the range of $1.86 billion to $1.94 billion.

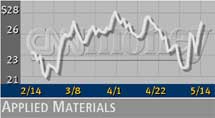
Shares of Applied Materials rose $1.38, more the 5 percent, to $28.02 after hours.  Top of page


  graphic

Most stock quote data provided by BATS. Market indices are shown in real time, except for the DJIA, which is delayed by two minutes. All times are ET. Disclaimer. Morningstar: © 2018 Morningstar, Inc. All Rights Reserved. Factset: FactSet Research Systems Inc. 2018. All rights reserved. Chicago Mercantile Association: Certain market data is the property of Chicago Mercantile Exchange Inc. and its licensors. All rights reserved. Dow Jones: The Dow Jones branded indices are proprietary to and are calculated, distributed and marketed by DJI Opco, a subsidiary of S&P Dow Jones Indices LLC and have been licensed for use to S&P Opco, LLC and CNN. Standard & Poor's and S&P are registered trademarks of Standard & Poor's Financial Services LLC and Dow Jones is a registered trademark of Dow Jones Trademark Holdings LLC. All content of the Dow Jones branded indices © S&P Dow Jones Indices LLC 2018 and/or its affiliates.

Most stock quote data provided by BATS. Market indices are shown in real time, except for the DJIA, which is delayed by two minutes. All times are ET. Disclaimer. Morningstar: © 2018 Morningstar, Inc. All Rights Reserved. Factset: FactSet Research Systems Inc. 2018. All rights reserved. Chicago Mercantile Association: Certain market data is the property of Chicago Mercantile Exchange Inc. and its licensors. All rights reserved. Dow Jones: The Dow Jones branded indices are proprietary to and are calculated, distributed and marketed by DJI Opco, a subsidiary of S&P Dow Jones Indices LLC and have been licensed for use to S&P Opco, LLC and CNN. Standard & Poor's and S&P are registered trademarks of Standard & Poor's Financial Services LLC and Dow Jones is a registered trademark of Dow Jones Trademark Holdings LLC. All content of the Dow Jones branded indices © S&P Dow Jones Indices LLC 2018 and/or its affiliates.