NEW YORK (CNN/Money) -
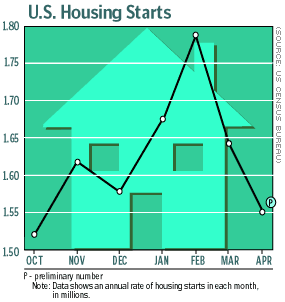
New home construction fell in the United States in April, the government said Thursday, as the red-hot housing market continued to retreat from stratospheric winter highs.
A separate government report showed new jobless claims rose again last week, as labor market weakness continued even as the economy began to recover from a recession.
The Commerce Department said the pace of housing starts fell 5.4 percent in April to an annual rate of 1.56 million units from a revised 1.64 million rate in March. Economists surveyed by Briefing.com expected a 1.625 million rate in April.
But new building permits, an indication of builders' expectations for future activity, showed strength, rising 0.3 percent to a 1.634 million unit rate in April, compared with a revised 1.629 million rate in March. Economists surveyed by Briefing.com expected a 1.625 million rate in April.

"The modest decline in single-family construction activity, coupled with the rise in permit requests, indicates that the housing market is holding in," said Joel Naroff, chief economist and president of Naroff Economic Advisors in Holland, Pa.
Separately, the Labor Department said the number of Americans filing new claims for unemployment benefits rose to 418,000 in the week ended May 11 from a revised 416,000 the prior week.
It was the seventh straight week that claims were above 400,000, a level pointing to a sluggish job market. Economists surveyed by Briefing.com expected just 405,000 new claims.
And the Philadelphia Federal Reserve Board said its closely watched monthly index of manufacturing activity in Pennsylvania, New Jersey and Delaware, fell to 9.1 in May from 12.3 in April. Economists surveyed by Briefing.com expected an index reading of 12.
U.S. stock prices were mixed in midday trading, while Treasury bond prices were mostly higher.
Housing market still strong
The housing market was one of the lone pillars of strength in the economy during a recession that likely began in March 2001. Low mortgage rates, driven in part by 11 Federal Reserve interest-rate cuts in 2001, boosted demand for houses and drove prices higher. Higher home prices padded consumers' balance sheets, easing the pain of falling stock prices and supporting spending.
An unusually mild winter sent the housing market soaring earlier this year, leading some observers to worry about the possibility of a housing bubble. While many economists long have warned that the winter's levels of strength could not continue, most doubt there is a speculative bubble that could lead to a sudden reversal of fortune for the housing market.
"I don't see any sign of housing activity having a significant slowdown on a national basis going forward," Chicago Federal Reserve Board President Michael Moskow said, according to a Reuters report.
Like many other economists, Moskow said he was "sure there was some overbuilding" in particular areas of the country, such as Silicon Valley in California, but not enough to have an impact on the national market.
Labor market still weak
It's still unclear how many of last week's new jobless claims were actually workers re-filing for benefits after Congress allowed an extension of benefits in March. The Labor Department has been unable to clearly separate new filers from re-filers.
The four-week moving average of new jobless claims, which smoothes out fluctuations in the weekly data, fell to 420,750 last week from a revised 429,250 the prior week. Continued claims, the number of people drawing unemployment benefits for more than one week, rose to 3.86 million in the week ending May 4, the latest data available, from a revised 3.78 million in the prior week.
The Labor Department said earlier this month that the unemployment rate rose to 6 percent in April, its highest level in nearly eight years.
Unemployment is a lagging indicator, usually rising even as the economy recovers because businesses are reluctant to hire more workers until they know the recovery is real and that demand will justify more production.
But with business productivity at the highest level in decades and corporate profits still in the doldrums, the lag time between economic recovery and new job growth could be as long as it was following the 1990-91 recession, when unemployment continued to rise for a dreary 15 months after the recession ended.
| |
 Related links
| |
| | |
| | |
|
"I think there's every reason to believe that another jobless recovery could be in the offing in the years immediately ahead -- one that would take a comparable toll on consumer demand," Morgan Stanley economist Stephen Roach, a noted pessimist during the latest downturn, said in a report.
The Philly Fed report painted a somewhat rosier picture. Though the headline index fell, 29 percent of businesses reported improving conditions, compared with 19 percent reporting worsening conditions, the fifth straight month gainers outpaced decliners.
And 17 percent of firms surveyed reported adding jobs, compared with 12 percent who cut jobs -- the first time in 19 months that manufacturing employment in the region showed signs of recovery.
"The region's manufacturing executives remain generally optimistic that business conditions will improve over the next six months," the Philly Fed said in its report.

|

