NEW YORK (CNN/Money) -
The U.S. economy grew at a slower pace in the first quarter than initially thought, the government said Friday, as business spending continued to lag at the end of the economy's first recession in a decade.
In a separate government report, April new home sales rose 1 percent to a stronger-than-expected annual rate.
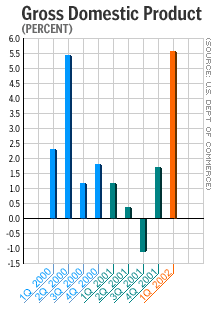
Gross domestic product (GDP), the broadest measure of the nation's economy, grew at a 5.6 percent annual rate in the quarter, the Commerce Department reported, compared with the government's prior estimate of 5.8 percent and 1.7 percent growth in the fourth quarter. Economists surveyed by Briefing.com had expected the GDP reading to be revised up to 6 percent.
"This is an economy coming back, but it's going to be a moderate recovery," said Anthony Chan, chief economist at Banc One Investment Advisors. "But we should not despair, since a balanced recovery has the best chance of turning into a longer-lasting recovery."
It was still the strongest quarter for the economy since GDP grew at an 8.3 percent rate in the fourth quarter of 1999. The government will revise the latest number again next month and could revise it again at any point after that.

U.S. stock prices fell in early trading, while Treasury bond prices were higher.
The biggest drag on economic growth in the quarter was the continuing slump in business spending, which fell 8.2 percent in the quarter, compared with the previous estimate of 5.7 percent. The reduction, amounting to about $26.3 billion, took nearly a full percentage point from the GDP rate.
Federal Reserve Chairman Alan Greenspan and other economists have identified business spending as the sector of the economy that holds the key to the recovery's strength. A decline in business spending led to the economic slowdown that began in March 2001, and businesses will not start to hire workers again until they're sure demand for their products, from both consumers and businesses, warrants higher production.
The first quarter's spending slowdown was still better than the 13.8 percent drop in the fourth quarter. And there have been hopeful signs of a turnaround more recently, such as Thursday's report from the Commerce Department showing a jump in orders for durable goods.
"Most of the [first quarter spending] decline was in structures. But when you look at capital equipment, that number is starting to bottom out, and there are signs in some of the monthly numbers that spending on equipment, machinery, etc., has bottomed out," said Scott Brown, chief economist at Raymond James & Associates. "Maybe an upward trend is starting to develop."
And corporate after-tax profits increased 0.9 percent in the quarter, the strongest gain since the second quarter of 2000, after falling 10.6 percent in the fourth quarter. A return to profitability could spur companies to spend more in the future.
Inventories, government spending boost GDP
The biggest boost to GDP again came from business inventories, which shrank at a much slower rate of $25.7 billion in the quarter, far below the $119.3 billion reduction in the fourth quarter.
The way the Commerce Department measures the change in inventories means that the $93.6 billion difference between the first and fourth quarters actually added to growth in the first quarter, since inventories shrank at a much slower rate, boosting GDP by nearly 3.5 percentage points.
| |
 Related links
| |
| | |
| | |
|
Excluding the change in inventories, real sales of domestic product rose about 2 percent after increasing 3.8 percent in the fourth quarter.
And government spending grew 6.7 percent in the quarter, adding about 1.2 percentage points to the GDP figure, after growing 10.2 percent in the fourth quarter.
"Strip away inventories and the government sector, and private-sector demand really wasn't that strong -- private-sector sales were up just 0.8 percent," Brown said. "We're still in a transition phase and not on a sustainable growth path yet."
Consumer spending continued to be the stalwart of the economy, though its strength was revised downward, growing at a rate of 3.2 percent. That's lower than the 3.5 percent initially estimated and the 6.1 percent gain in the fourth quarter. On an annualized basis, consumer spending makes up $6.6 trillion of the nation's roughly $10 trillion economy.
Much of the resilience in consumer spending has to do with 11 interest-rate cuts by the Fed in 2001. The central bank has kept rates at 40-year lows so far in 2002, and it will have to start raising rates at some point just to take some of the stimulative fuel out of the economy and keep inflation in check. But many economists think the Fed will wait until unemployment stabilizes before starting that process.
The Fed has little reason to fear inflation, apparently -- the price index for personal consumption expenditures, an inflation measure closely watched by policy makers, rose just 0.7 percent in the first quarter, compared with a 0.8 percent gain in the fourth quarter.
Housing market still strong
Separately, the Commerce Department said new home sales rose 1 percent in April to an annual rate of 915,000 units, after falling 3 percent to a 906,000-unit pace in March. Economists surveyed by Briefing.com expected a pace of 885,000 units.
"Housing continues to be strong," said Robert Van Order, chief international economist at mortgage security firm Freddie Mac (FRE: up $0.44 to $64.89, Research, Estimates). "While it's going to slow down at some point, with mortgage rates at 7 percent and the economy recovering, nothing much bad can happen to it."
Also lifting consumers' spirits has been the relentless strength of the housing market. Lower short-term rates eventually led to lower mortgage rates, making it easier for people to buy houses. Increased demand sent prices higher, making homeowners' balance sheets look better and easing the sting of falling stock prices.
Inventories of new homes rose to 316,000 from 310,000 in March, the highest level since December 1996. But that number amounts to only 4.2 months' worth of sales at the current pace, a relatively tight inventory level that should only push prices ever higher.
"The supply of homes is very tight for new and existing homes," said Lawrence Yun, senior economist with the National Association of Realtors. "We will continue to see healthy home-price appreciation. For non-home owners, that's bad news. But for home owners, that's building wealth."
Yun, Van Order at Freddie Mac and other economists downplayed any concerns that the housing market was in a "bubble," which would put that home-equity wealth in jeopardy if demand suddenly dried up and prices suddenly fell.
"There are places in the country where we might see bubbles, but not nationwide," Van Order said. "We'll see price growth slow down, but it will keep up with inflation."

|

