NEW YORK (CNN/Money) -
Americans made more money but spent less in May, the government said Friday, as consumers, the backbone of the U.S. economy, retrenched a bit after spending throughout the first recession in a decade.
Economists pointed out that most of the decline was a result of a big drop-off in auto sales, bad weather, and an early Easter that led consumers to spend much more than usual in April, making May look worse in comparison.
Personal spending fell 0.1 percent to $7.33 trillion after rising 0.6 percent in April, the Commerce Department said, while personal income rose 0.3 percent to $8.97 trillion after rising 0.2 percent in April.
It was the first decline in spending since a 0.3 percent drop in November 2001. Economists surveyed by Briefing.com expected spending to be flat and income to rise 0.3 percent.

"This was a combination of both bad weather and the timing of when Easter fell, so it made the earlier period look better and this period look worse," said Ken Goldstein, economist at the Conference Board, which publishes a closely watched monthly measure of consumer confidence. "When you wash [these effects] out, you essentially get the signal that consumption is not going like gangbusters, but at least it's reasonably strong."
Personal savings rose to $240.6 billion from $218.4 billion in April. The savings rate -- personal savings as a percentage of disposable income -- rose to 3.1 percent from 2.8 percent in April.
Separately, the University of Michigan revised its reading of consumer sentiment in June to 92.4 from a previous estimate of 90.8, according to a Reuters report. Economists surveyed by Briefing.com expected a reading of 90.8. The sentiment index was reportedly 96.9 in May.
And purchasing managers in the Chicago area said their index of manufacturing activity in the region fell to 58.2 in June from 60.8 in May. Economists expected, on average, a reading of 58.0. Any reading above 50 indicates growth in the industry.
U.S. stock prices rose in early trading, ignoring the latest corporate accounting scandal, this one involving Xerox Corp. (XRX: down $1.65 to $6.35, Research, Estimates) Treasury bond prices were mixed.
Consumer strength being tested
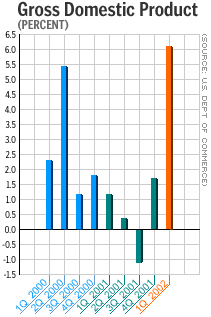
Consumer spending makes up about $6.6 trillion of the $10 trillion U.S. gross domestic product (GDP), the broadest measure of economic strength. GDP grew 6.1 percent in the first quarter, helped by a 3.3 percent gain in consumer spending.
But many economists think that GDP will grow at a much slower pace in the second quarter and that consumer spending will likely grow only half as much as it did in the first quarter. For one thing, there's not much pent-up consumer demand -- consumers have never stopped spending long enough to develop it.
And the daily parade of splashy corporate scandals -- from Enron to Martha Stewart to WorldCom Group -- combined with constant worries about future terror attacks and turmoil in the Middle East don't exactly make for an environment conducive to wild spending.
"Right now, [spending] is running at a roughly 1.5 percent pace and may not hit 2 percent for the quarter," said Joel Naroff, chief economist and president of Naroff Economic Advisors in Holland, Pa. "But with income available, it would be surprising if consumption does not pick up."
The decline in the University of Michigan sentiment data was the biggest since the period following the Sept. 11 terror attacks, and it follows this week's report from the Conference Board that its measure of confidence fell to the lowest level since February.
In the survey of 500 homes, available only to paying subscribers, its current conditions index, measuring consumer feelings about the present state of their finances, fell to 99.5 in June from 103.5 in May, according to Reuters, though the June number was upwardly revised from 97.9.
The expectations index, measuring feelings about the coming 12 months, fell to 87.9 from 92.7 in May, Reuters reported, but that was also upwardly revised, from 86.2.
"The good news is that the expectations index is now more or less in line with the state of the stock market, so any further dips should be modest," said Ian Shepherdson, chief U.S. economist at High Frequency Economics Ltd.
Buying houses instead of cars
Driven by a decline in auto sales, personal spending on durable goods fell 2.4 percent in May, the Commerce Department report showed, the worst showing since a 3.6 percent decline in December 2001. Spending on non-durable goods fell 0.7 percent, the worst performance since a 0.3 percent drop in November.
Strong consumer spending, boosted by 11 interest-rate cuts by the Federal Reserve and buying incentives from manufacturers -- automakers, most notably -- helped make a recession that began in March 2001 one of the shortest and mildest in history.
| |
 Related links
| |
| | |
| | |
|
Going forward, however, the economy's strength will likely depend on business spending. A slump in capital investment in 2000 led to a manufacturing recession, more than a million job cuts, a higher unemployment rate and the broader recession. When companies start buying goods from each other again, they will boost production and, eventually, hiring.
The Chicago purchasing management index hinted at a continuing rebound in manufacturing, and its employment index crept up to 48.9 from 47.3 in May, inching closer to a recovery in hiring.
Consumer spending could also be supported by the continuing strength of the housing sector. Demand for homes, driven by ever-falling mortgage rates, have improved consumers' balance sheets, and a rush to refinance has put more cash in their pockets.
New homes were built at an annual rate of 1.7 million units in May, while sales of new and existing homes were at or near record levels -- and money will have to be spent to fill those houses with furniture and appliances.
"People were probably too busy closing their deals on the record number of homes bought to visit [auto] showrooms," Naroff said. "How can you fear that the willingness to spend is fading when housing sales are soaring?"

|

