NEW YORK (CNN/Money) -
U.S. consumers spent with gusto in July but their incomes were flat, the government said Friday, and published reports said a key measure of consumer confidence was revised lower in August -- potentially worrisome signs for the world's largest economy.
Yet another report showed stronger-than-expected manufacturing activity in the Midwest in August.

The Commerce Department said personal incomes were unchanged last month after rising a revised 0.7 percent in June. Personal spending jumped 1 percent after rising 0.5 percent in June. Economists, on average, had expected income to rise 0.3 percent and spending to rise 0.8 percent, according to Briefing.com.
"Flat incomes are disappointing, but this followed an outsized ... rise in June. The trend is still up," said an Shepherdson, chief U.S. economist at High Frequency Economics Ltd. "Consumers have the ability to spend freely; only the inclination is in doubt."
The gain in spending was the largest since a 2.6 percent gain in October 2001, while the income reading is the weakest since it was unchanged in November 2001.
Americans saved 3.4 percent of their incomes, after saving 4.2 percent in June.
Separately, the University of Michigan's consumer sentiment index for August was revised to 87.6 from an initial reading of 87.9, according to a Reuters report. [Click here for more details.]
And the National Association of Purchasing Management-Chicago said its index of regional manufacturing rose to 54.9 from 51.5 in July. It was the seventh straight reading above 50, pointing to an expanding regional manufacturing economy. [Click here for more details.]
| |
 Related stories
| |
| | |
| | |
|
The manufacturing data helped lift U.S. stock prices, which were mostly higher in morning trade. Treasury bond prices were mixed.
Consumer spending is watched closely by policy-makers and economists since it fuels about two-thirds of gross domestic product (GDP), the broadest measure of the nation's economy.
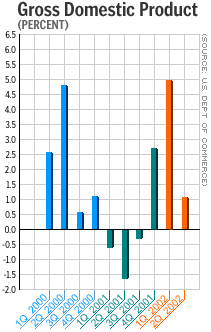
Consumer spending rose just 1.9 percent in the second quarter -- compared with 3.1 percent in the first quarter and 6 percent in the fourth quarter of 2001 -- and GDP rose just 1.1 percent as a result.
"Despite the faltering confidence numbers, consumption remains strong, and that is all that really matters," said Joel Naroff, president and chief economist of Naroff Economic Advisors in Holland, Pa.
But if incomes are stagnant or falling, then consumers might be less inclined to spend in the future. Wages and salaries, the largest component of personal income, fell 0.2 percent in July after rising 0.8 percent in June, the department said in its report.
Much of that decline has to do with continuing weakness in the labor market. With businesses reluctant to hire new workers and competition for jobs high, there's little upward pressure on wages. The Labor Department reports on August unemployment next Friday.
"Next week's jobs report will be key to the income data and need to be watched as much for that reason as for the unemployment rate and job growth," Naroff said. "Another month of weakness in the hours worked and wages data would be worrisome."
Much of July's spending gains came in response to aggressive incentives from automakers, including zero-percent financing on new models, which helped push spending on durable goods up 3.7 percent, compared with 1.6 percent in June.

|

