NEW YORK (CNN/Money) -
U.S. Treasury prices darted lower Tuesday when a key U.S. manufacturing survey revealed only a minor contraction in that sector, adding fuel to an early burst of profit-taking.
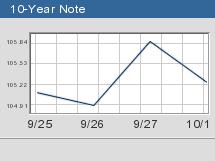
Around 4:00 p.m. ET, the benchmark 10-year note fell 1-1/32 to 105-11/32, taking its yield up to 3.72 percent from Monday's 44-year low of 3.60 percent. The 30-year bond fell 1-10/32 to 109-22/32, yielding 4.75 percent from 4.67 percent.
Five-year notes lost 23/32 of a point to 102-12/32, taking yields to 2.72 percent from 2.56 percent. At the very short end, two-year notes eased 7/32 of a point to 100-5/32, nudging yields up to 1.8 percent from Monday's record closing low of 1.69 percent.
Prices fell on the release of the Institute for Supply Management index, which fell to 49.5 in September from 50.5 in August. Although well below a Reuters consensus forecast from last week, the data actually were an upside surprise to investors who had braced this week for an even weaker number.
Some traders reported lowering their ISM forecasts after a Midwest manufacturing survey came in well below expectations on Monday. The benchmark 10-year note tumbled after the data release, retracing Monday's sharp gains. But U.S. stocks took heart, with the Dow Jones industrial average finishing 4.5 percent higher
"It certainly wasn't encouraging, but I don't think it was a surprise after yesterday," said Bill Hornbarger, fixed-income strategist at AG Edwards & Sons, of the manufacturing data. "I think most people thought the number was going to be a little softer."
The ISM number fell just below the crucial 50 mark that divides expansion and contraction. A reading north of 50 signals expansion. A reading below 50 means contraction.
The new orders index also ticked up to 50.2 from 49.7 in August. Still, the data revealed some areas of weakness that may support debt prices down the road.
For example, the employment index slipped to 44.9 from 45.8, causing some analysts to wonder if Friday's September U.S. jobs report might be weak enough to warrant another Federal Reserve rate cut.
"We've seen the employment component of this report continue to slide," said Ethan Harris, co-chief economist at Lehman Brothers. "It looks like this will probably feed through to the employment report."
Average forecasts in a Reuters poll are for payrolls to rise 5,000 after a 39,000 gain in August. alongside weekly chain store sales.
Other U.S. data out Tuesday were generally soft, with August construction orders down, as were weekly chain store sales.
Narrowing duration gap trims debt demand
Treasurys came under pressure overnight on news that mortgage funder Fannie Mae (FNM: Research, Estimates) had narrowed its portfolio duration gap to minus 10 months in September from a record wide of minus 14 months in August.
Bonds received a boost last month when Fannie reported its gap had reached minus 14 months. Speculators took the news to mean Fannie Mae would have to extend its duration by buying other types of debt such as Treasurys.
"They made a pretty significant headway in closing the duration gap in just a month's time," said AG Edwards' Hornbarger. "A lot of people were front-running that trade, and now the feeling is that Fannie Mae is probably not going to be as aggressive in the market. It takes a buyer out of there."
Duration is a measure of a portfolio's exposure to interest rate risk. The larger the negative reading the greater the agency's exposure. Now that Fannie's need or duration was seen as less urgent, the longer end was suffering, particularly the 10-year.
Dollar gains on yen, euro
Around 4:00 p.m. ET, the euro purchased 98.35 U.S. cents, down from 98.64 cents Monday.
The yen, dragged down earlier as a mixed business sentiment survey overshadowed optimism that Japan would implement aggressive measures to heal the ailing economy, also extended its losses against the firming dollar. Around 4:00 p.m. ET, the dollar bought ¥122.62, up from ¥121.82 late Monday.

-- from staff and wire reports
|