NEW YORK (CNN/Money) -
Wholesale prices in the United States posted their biggest gain in 13 years in January, the government said Thursday, while the number of Americans filing new claims for unemployment benefits rose above 400,000 last week.
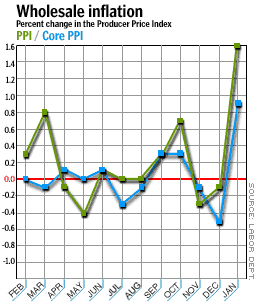
The Labor Department said its producer price index (PPI), a measure of wholesale prices, rose 1.6 percent -- the biggest one-month jump since January 1990 -- after falling 0.1 percent in December, while "core" PPI, which excludes volatile food and energy prices, rose 0.9 percent after falling 0.5 percent in December.

Economists, on average, expected just a 0.5 percent gain in PPI and a 0.1 percent gain in core PPI, according to Briefing.com.
"This is a continuation of a trend that's already been in place," said Arnhold & S. Bleichroeder economist James Padinha. "We don't have a huge inflation problem, but it seems to me that people don't give enough weight to the possibility something like that is brewing."
Separately, the Labor Department said initial claims for unemployment benefits surged to 402,000 for the week ended Feb. 15 from a revised 381,000 the prior week. Economists, on average, expected 385,000 new claims, according to Briefing.com. Any number of claims above 400,000 is considered by many economists to represent a weakening labor market.
Meanwhile, the Commerce Department said the U.S. trade deficit rose to a record $44.2 billion in December from $40.1 billion in November.
On Wall Street, stock prices fell after the reports, the dollar lost ground and Treasury bond prices were mixed.
| Related stories
|

|
|
|
|
Inflation has been a distant memory in an economy that suffered through a recession in 2001 and a slow and sluggish recovery in 2002. In fact, some economists have been worried for some time about the possibility of deflation, when falling prices undercut corporate profits and lead to further economic weakness.
But while some goods-producing sectors have experienced deflation for several months, most prices have continued to climb, and Thursday's PPI report indicates inflation might be more of a threat than previously thought.
Much of the gain in headline PPI reflects a 4.8 percent jump in energy prices. Oil prices have surged in recent months as an oil workers' strike in Venezuela, the world's No. 5 oil producer, undercut global crude supplies, and traders have added something of a "war premium" to oil prices in anticipation of a U.S.-led war in Iraq.
As a result, consumer gasoline and fuel-oil prices jumped 13.7 percent and 19.7 percent, respectively, while crude oil prices paid by wholesalers rose 20.4 percent.
But higher motor vehicle prices also pushed up the "core" PPI figure, with car prices rising 3.5 percent and light truck prices up 4.1 percent.
Producers have faced higher commodity prices for some time, but have been largely unable to pass those higher prices on to consumers. For that and several other reasons, companies have been cutting jobs and keeping work forces lean to keep costs low.
In the Labor Department report, the four-week moving average of jobless claims, which irons out weekly fluctuations in the volatile data, rose to 394,750 from a revised an increase of 4,750 from a revised 390,000 the prior week.
Continued claims, the number of people drawing benefits for more than a week, rose to 3.44 million in the week ended Feb. 8, the latest data available, from a revised 3.29 million the prior week.

|

