NEW YORK (CNN/Money) -
On the proverbial playing field, some win while others lose. That's how competition works. And so it goes on Wall Street as well.
Yes, the S&P 500 is up nearly 25 percent this year and the Dow is holding steady above 10,000 for the first time in 18 months. Yes, plenty of stocks have enjoyed a huge run up.
In fact the top 10 best S&P 500 performers are each more than 150 percent higher this year, and 460 of the S&P 500 are in positive territory; 415 are up better than 10 percent.

Many investors have done very well and are quite happy as the year winds down. But some aren't, in particular those who are heavily invested in telecom, drugs and energy stocks, to name a few.
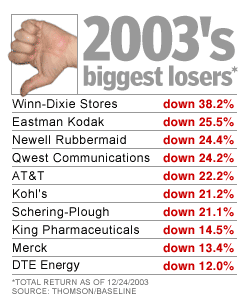
The table at the right shows the top 10 biggest losers in the S&P 500 as of the close of trading on Dec. 24. Here is a closer look a the biggest losers of them all. (For a look at the year's biggest winners, click here.)
Winn-Dixie Stores (WIN: Research, Estimates), down 38.2 percent as of the close on Dec. 24. The struggling supermarket operator has had one tough year. Its same-stores sales have slid each quarter versus the previous year and its earnings have also showed marked declines as the company has faltered in the face of increased competition and a spate of negative analyst calls.
Most recently, Winn-Dixie reported a fiscal first-quarter profit that fell 96 percent from a year ago. The company blamed the decline on its increased efforts to boost advertising, improve service and remodel stores as a way to boost earnings. Analysts say that the company's success with this revitalization plan over the next year will be crucial. Ratings agency Standard & Poor's recently cut its rating on the stock to 2 stars (avoid) from 3 stars (hold).
Sector mate Safeway (SWY: Research, Estimates) is the No. 14 loser of the year, down 9.3 percent. Other grocers are down as well, amid the two-months-and-counting strike in California and the struggle to compete with retail behemoths like Wal-Mart (WMT: Research, Estimates). All of which makes the grocery sector overall among the year's worst performers.
Eastman Kodak (EK: Research, Estimates), down 25.5 percent. It's no secret that Kodak's profits and share price have been put through the shredder in the past few years. The company has suffered along with the airlines, hotels and other leisure sectors in response to the global slowdown in travel that was the result of the sluggish economy, the events of September 11, not to mention the SARS outbreak this year.
But the travel industry is getting back into the swing of things this year, with recent industry data showing air travel back near pre-September 11 levels. However, that slowdown is just one of Kodak's problems.
The company has also struggled mightily to catch up after realizing too late that it needs to transform itself from a traditional camera and film business into a more multi-layered one. This fall Kodak announced and began to implement a number of initiatives to combat the slowdown it has suffered -- cutting its dividend, cutting its investments in the traditional film business, getting into the ink-jet printer business and generally trying to become more competitive amid the increased demand for digital products and services.
Newell Rubbermaid (NWL: Research, Estimates), down 24.4 percent. The maker of everything from Sharpie markers to Levolor blinds has dropped one bomb after another this year.
Its earnings dropped from the previous year in the first, second and third quarters of 2003 and it warned that fourth-quarter results would miss expectations, too.
The company has also twice this year lowered its profit outlook for the full year, most recently earlier in December. That second warning was six weeks after the company narrowed its previous forecast to the lower end of its range. Newell has also twice lowered its 2004 forecast.
Weakness in some brands, the costs of discontinuing or reducing the company's involvement in certain brands, as well as overall soft sales for the industry -- not to mention tornado damage to several plants most recently -- have all been cited as reasons for the weak results this year.
Qwest Communications (Q: Research, Estimates), down 24.2 percent. The company has a variety of problems eating away at its profits and stock price.
But Qwest is not alone. AT&T is having one hell of a year, and so are the Baby Bells, particularly Verizon Communications (VZ: Research, Estimates) and SBC Communications (SBC: Research, Estimates).
AT&T is the fifth biggest loser of the year, while Verizon is No. 17 and SBC is No. 28. The local telephone providers have been struggling mightily during an industry slowdown, most recently amid an increased need to compete with cable companies which offer voice services using Internet technology.
On top of the sector slowdown, Qwest has its own problems. The company is still facing an accounting probe by federal regulators related to having to restate lower earnings for the 2000 and 2001 fiscal years.

|
