NEW YORK (CNN/Money) -
After running in place for several months, the stock market has recently shown troubling signs of fatigue, leading some analysts to believe that, instead of prepping for a summer rally, investors should stay away from stocks.
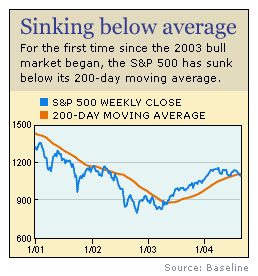
A few technical indicators are starting to become worrisome. After flirting with its 200-day moving average for several months, the S&P 500 has finally broken through, closing below it in four out of the past five trading days, despite a mild rally late Thursday.
Back at the beginning of the bull market in early 2003, it was considered a bullish milestone when the S&P crossed above its 200-day moving average. Recrossing it in the other direction is, well, not so bullish.
Some technical analysts are also on the look-out for the so-called "death cross," in which the market's 50-day moving average converges with its 200-day average. The last "golden cross," when the S&P's 50-day crossed above the 200-day in early 2003, was another bullish sign. The two are converging again, but this time the 50-day is moving in the opposite direction.
Meanwhile, the S&P is treading perilously close to what some analysts consider its technical support level of about 1,080. This has lately been the point at which traders have seen buying opportunities and jumped back in. If they've lost their appetite for stocks even at that low level, prices could be headed much lower.
With these technical factors partially in mind, the Standard & Poor's investment policy committee on Wednesday voted to cut its recommended exposure to stocks, to 45 percent of a portfolio from 50 percent, and raise cash levels to 35 percent from 30 percent.
"The equity markets will likely trend lower in the weeks ahead," the committee wrote in a research note released Wednesday evening.

The committee cited technical worries and the market's decidedly negative response even to good news such as Microsoft's $75 billion cash give-away and Fed Chairman Alan Greenspan's recent bullish tone in explaining its decision.
On Wednesday, the day after both those pleasing stories made headlines, the market sold off on unusually heavy volume. Happy, happy. Joy, joy.
The committee also cited lingering uncertainty and worries about a host of fundamental issues, including decelerating economic and earnings growth, the possibility of higher interest rates, oil prices hanging above $40 per barrel, the outcome of the presidential election in November and the war in Iraq, to name a few.
Unless and until traders get a feel for the direction of some or all of these factors, stocks could stay lousy for quite a while.
"Short of a significant decline in oil prices, we do not foresee a likely catalyst that would spur the market significantly higher at this time," Francois Trahan, chief strategist at Bear Stearns, wrote in a note to clients on Thursday. "The equity market will likely remain in a transition phase, which could see the strong equity market uptrend of 2003 evolve into a slight downtrend in early 2005."
Where's the wall of worry?
What's even more discouraging, in a way, is the fact that not everybody agrees with this fairly gloomy assessment. Sentiment surveys are still fairly bullish -- bad news for contrarian technical analysts, who like to do the opposite of what everybody else is doing.
| Related stories
|

|
|
|
|
For example, the latest Investor's Intelligence survey, released Wednesday, showed bulls outnumbered bears 53 percent to 20 percent. This ratio has come down lately, but it's still much higher than average, according to Jason Goepfert, technical analyst and CEO of Sundial Capital Research.
"It continues to look like the majority of traders believe in a trading range, and so we are not seeing an up-tick in bearish bets as we fall, unlike our prior lows," Goepfert wrote on his Web site on Friday. "It would be healthier – and set up better risk/reward trades from the long side – if we could get some evidence that traders had exorcised their bullish bias to some degree."
Bulls had to be encouraged by Thursday's market action, as a steep morning selloff reversed course and turned into a mild, late-afternoon rally -- just after the S&P brushed up against its 1,080 support level. And the S&P continued to hover above that resistance level throughout the morning on Friday.
In any event, if sentiment does later deteriorate and stocks do continue to sell off -- some analysts believe the market could still be in for a correction of 10 percent or more -- that may be a good time to jump back in. On the other hand, if stocks aren't going to sell off, now may be as good a time as any to get back in.
"We continue to think the economy is expanding pretty nicely, and we still see earnings growth is healthy as well, said Andy Engel, senior research analyst at the Leuthold Group. "As a whole, when we take all of the indicators we're looking at, we would come down on the side that this is a pretty good buying opportunity."
"But continued deterioration in the technicals could cause us to change our mind," he added.
And of course, there's still money to be made, even in a sideways or falling market. Investors may just have to work a little harder to find opportunities.
"It's important to pay attention to the [broader] market, but, frankly, it hasn't gone anyplace for the past six months; and, if you take the longer view, it hasn't gone anyplace for the past six years," said John Bollinger, technical analyst and founder of Bollinger Capital Management. "But within those years, there were tremendous opportunities within stocks, bonds, electronically traded funds, mutual funds of all sorts, currencies, precious metals and commodities, all of which investors could have taken advantage of."
"I do believe that the conditions that prevailed for the past six years will prevail for the next six, or longer," he added.

|

