NEW YORK (CNN/Money) - If the historical performance of the Dow Jones industrial average is any guide, John Kerry will be the 44th president of the United States.
 |
|
| Will the Dow Jones come through for Kerry? |
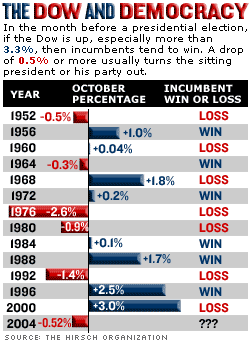
According to a recent study by the Hirsch Organization, publishers of the Stock Trader's Almanac, if the Dow loses more than 0.5 percent of its value in the month of October before Election Day, then an incumbent president is going to lose his job. The Dow fell 0.52 percent in October.
This predictor has been true without exception from 1904 to the present, according to Jeffrey Hirsch, editor of the Stock Trader's Almanac and president of the Hirsch Organization.
The 30-share Dow, the world's most widely watched stock market gauge, closed at 10,080.27 on Sept. 30 and at 10,027.47 Friday, the last trading day in October.
So what would it have taken for the indicator to point to a Bush win?
For the president to be assured of a win, the Dow would have to be at 10,413 or above at the end of October, Hirsch said. That's because incumbents usually win when the Dow rises in October, but this is especially so if the gain is 3.3 percent or more.
If the Dow is up for the month but the gain is less than 3.3 percent, that's good for the incumbent but not a sure thing. When the gain is at least 3.3 percent, however, the incumbent has always won, according to Hirsch.
Hirsch said there are other signs in the market's recent performance pointing to a Kerry victory.

His organization has also studied what happens to incumbents based on stock market performance from the end of the most recent political convention -- this year, the Republican National Convention in New York -- until the election.
The Dow closed on Sept. 2 at 10,260.20 after the RNC wound down. For President Bush to win, the Dow would have to rise at least 260 points or so from current levels, bringing it back into positive territory, according to this indicator.
This post-convention indicator has correctly predicted presidential elections since 1900, said Hirsch, with two notable exceptions.
The first one occurred in 1956, when Dwight Eisenhower won his second term. That year, the Dow lost 2.5 percent between the end of the last convention on Aug. 24 and Election Day.
But the Soviet army rolled its tanks into Hungary that October, making the return of an incumbent who had been a five-star general in World War II particularly appealing.
The post-convention indicator was undone again in 1984, when Ronald Reagan won his second term in office. That year, the Dow lost 0.6 percent from the day after the convention until the election, when it closed at 1,229.24 on the eve of Reagan's landslide.
"But that was just a minor correction on the heels of a huge bull market. The market's former success seemed to be more of an indicator that year," said Hirsch.
There is some hope for President Bush, however.
Looking just at the last week, the market has had a bit of a run, and although he hasn't studied the Dow's performance for each week before a presidential election over the last century, Hirsch said that the Dow's nearly 270-point rise since last Friday "is better news for Mr. Bush."

|