Job growth: Weakest since Katrina
April payrolls are far weaker than forecasts but wages post surprising gains; unemployment rate holds steady.
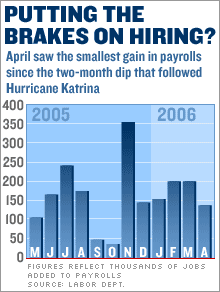
NEW YORK (CNNMoney.com) - Payroll growth in April was the weakest since shortly after last summer's hurricanes, the government said Friday, but there were signs of a tighter labor market in the report as well. Employers added just 138,000 jobs in April, the Labor Department reported, down sharply from a revised 200,000 in March. Economists surveyed by Briefing.com had forecast a net gain of 200,000 in payrolls.
It was the lowest number of jobs added to the economy since October, when the labor market was still suffering from a two-month slowdown that followed hurricanes Katrina and Rita. April's job growth was also well below the average of about 180,000 over the last year. But at the same time the job market remained tight enough last month that unemployment stayed low and wages rose sharply, with average pay for hourly workers rising a surprisingly strong 0.9 percent - three times the average economists' forecast - to $16.61 an hour. The brought hourly wage growth over the last 12 months to 3.8 percent, the biggest year-over-year gain since August 2001, just before the Sept. 11 terrorist attacks. The unemployment rate held at 4.7 percent, matching economists' forecast. On Wall Street, stocks rallied on hopes that the weaker-than-expected labor market might mean that the Federal Reserve is not as likely to raise interest rates further at its June 29 meeting. Another quarter-percentage point increase in the central bank's fed funds rate is widely expected at the meeting Wednesday. (Full story). Despite investor enthusiasm with the report, the wage component could end up worrying central bankers concerned that a tighter labor market will drive up wages and feed inflationary pressures. The gain in hourly wages over the last year outpaced inflation, topping the 3.4 percent increase in prices paid by consumers over the 12 months ending in March, before the recent spike in gasoline prices. The upward pressure on wages, as well as rising energy prices, could force up the rate of inflation. "I think the wage number is more significant than what I think is maybe an aberration in the payroll number," said John Silvia, chief economist with Wachovia. "I'm surprised markets, especially the bond market, isn't more focused on that. Sometimes in life people see what they want to see." Treasury bond prices rose along with stocks, pushing the yield on the benchmark 10-year Treasury down to 5.11 percent from 5.15 percent late Thursday. Bond prices and yields move in opposite directions. Silvia said the shortfall in jobs compared to forecasts was due to a 36,000 decline in people working in retail, which seemed out of line with other reports showing strong retail sales. "Even if they're hiring less, I don't see them laying off people," he said. Even with the weak payroll number and the downward revision in March, the pace of job growth over the last three months is enough to add about 2 million jobs a year. _________________ Work and the housing boom: Full story. For a look at MONEY Magazine's ranking of the best jobs in America, click here. For a look at BUSINESS 2.0's look at the next job boom, click here.
For more on the job market and what it means to you, click here. |
| |||||||||||

