|
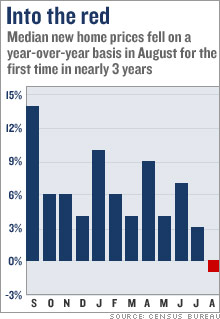
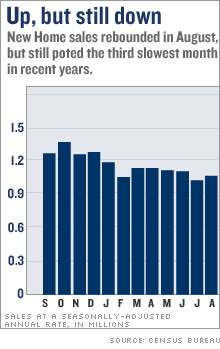
New home sales up, but weakness persists While August is first gain in five months, prior month sales revised downward and home prices fall year over year. NEW YORK (CNNMoney.com) -- New home sales posted the first gain in five months in August, the government said Wednesday, but the report also indicated further weakness in the housing market in the form of lower prices from a year earlier. New homes sold at an annual pace of 1.05 million in August, according to the Census Bureau report. While that's up from the revised reading of a 1.01 million sales pace in July - but the July number was revised from the original reading of a 1.07 million rate a month earlier.
The August reading was roughly in line with forecasts of economists surveyed by Briefing.com of 1.04 million. It's also the third weakest month of sales reported since May 2003, a period of 40 months. David Seiders, chief economist for the National Association of Home Builders, said it is tough to see this as a strong report for new home sales, given the sharp revisions in the reading for July as well as May and June also being adjusted lower. "I guess it's nice to see a positive number on the preliminary reading (for August), but there will probably be a significant revision to this and it will probably be down," he said. He said the sampling used for the preliminary readings in the report is relatively small. The number of completed homes for sale at the end of the month once again set a record high, reaching 148,000 homes. That's the 11th month out of the last 12 that supply has increased. But the total homes available for sale was slightly lower, due to a drop in homes under construction that are for sale to the lowest level since January. A separate report from the Census Bureau last week showed a drop in both housing starts and building permits. Prices lower The glut of homes for sale helped push the median price of a new home in August to $237,000, down 1.3 percent from the price level a year earlier. Median is the point at which half the homes sold go for less and half go for more. A National Association of Realtors report Monday said the price of existing home sales in August fell from year-earlier levels, the first year-over-year decline in that key price measure in more than 11 years. But new home sales prices showed a year-over-year decline as recently as December 2003. The median new home price in April was down 8 percent from the record high reached in April of this year. Seiders said the new home prices are probably somewhat softer than the report indicates, as many builders are using incentives such as covering closing costs or offering extra features on homes at no charge in order to support sales in a slumping market. He said the year-over-year decline in price is not a surprise, given what he's hearing from members. "We do know a lot of builders have been trimming prices, as well as doing all those incentives to hold prices up," he said. Wachovia economist Phillip Neuhart said he doubts that this is the bottom of the new home sales decline. "Yes, mortgage rates have come down nicely and inventories may be subsiding, but builders' sentiment remains at fifteen-year lows and housing starts are posting drastic declines," he said. "We have yet to reach pre-boom sales levels, which we expect to see before the sales market reverses the current downward trend." He said that while new home sales are likely to be volatile in the coming months, he expects the softness to continue at least into the latter half of 2007. The nation's leading home builders, including Pulte Homes (Charts), KB Home (Charts), Lennar (Charts), Hovnanian Enterprises (Charts), Toll Brothers (Charts), and Centex (Charts) have all seen their sales, earnings and new orders plunge have all seen their earnings and new orders plunge. Lennar warned Tuesday that the new home market has yet to bottom out as it cut its guidance for the rest of the year. A number of builders have also reported an increase in canceled orders for new homes. That also probably means sales are not as strong as this report indicates, since it records a new home sale when a contract is signed, not when the sale is closed months later. But the fact that the new home sales numbers are based on sales contracts makes the report more a forward-looking reading than the existing home sales report from the Realtors, which records a sale at the time of closing, generally a month or two after the contract is signed. ______________________________________ |
|