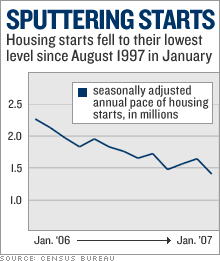
Housing starts plungeHousing starts fall much more than forecast, lowest level since '97; permits also fall as single-family permits hit 6-year low.NEW YORK (CNNMoney.com) -- Housing starts plunged in January to the slowest pace in more than nine years as the latest government reading on the battered housing market seemed to suggest it is not stabilizing as some had hoped. New homes started in January fell 14.3 percent to an annual rate of 1.41 million from the 1.64 million pace in December, the Census Bureau reported Friday. Economists surveyed by Briefing.com had forecast a 1.6 million rate for January.
 Mortgage Rates
The last time starts fell to a pace this slow was August 1997. The number is not only well below the December pace, but it is 22 percent below the average for all of 2006, when housing was already slowing down, and about 32 percent below the record building pace through all of 2005. The slump was widespread. Only the Northeast, the smallest region in terms of new home construction, posted a rise in starts compared to December. But starts were down 15.2 percent in the Midwest, 11.2 percent in the South and 28.5 percent in the West. Applications for new home permits, which is generally viewed as a measure of builders' confidence in the market, fell 2.8 percent to an annual 1.57 million rate from 1.61 million a month earlier, which was a bit below economists' forecast of a 1.59 million pace. The housing permit reading was helped by a second, straight month of strong permit application for buildings with five or more units. The permits for single-family homes fell 4 percent to a six-year low. Wachovia economist Phil Neuhart said that the report suggests that those who believed that there was a stabilization in home building, based on the strong December report, were pre-mature. He said the jump in both permits and starts in December could actually have hurt January numbers, as an exceptionally warm and dry month across much of the country pulled some work that normally would have started in January into the December period. "We have to remember winter months are volatile in this series," he said. "But we never thought we had found a bottom. We think home building will be weak through spring, maybe until the third quarter." The one piece of good news in the report is it could help cut down on the glut of homes available for sale on the market, which has been pushing down prices for both new and existing homes. But it also shows continued caution on the part of builders. "Builders could be seeing increase traffic but they won't start building new homes until they off-load their inventory," Neuhart said. "There are two sides to this, there's the construction, and then there's sales traffic. The reports showing some stabilization could be due to sales." But stronger sales and even better housing prices won't help the nation's overall economy, which had depended on strong home building to spur growth through much of the decade. Neuhart said that Wachovia is forecasting that home construction will be a drag on the gross domestic product, the broad measure of the nation's economic activity, throughout all of 2007. The housing sector hit a severe slump in 2006 after a record building boom in 2005 left a glut of homes available for sale on the market, pushing down prices. On Thursday, the National Association of Realtors reported the deepest and most widespread decline in home prices on record during the fourth quarter. But some other recent readings have also suggested a more recent stabilization in the battered real estate market. The National Association of Home Builders' survey of its members, released Thursday, showed builders' confidence at its best level since June, although the builders surveyed still saw the market as a weak one. The nation's leading homebuilders have all reported declining sales and prices for new homes, due greatly to the glut of new homes available for sale on the market. KB Home (Charts) reported a net loss of $49.6 million, or 64 cents per share, for the fiscal fourth quarter ended Nov. 30, earlier this week. Other leading builders reporting weakness in prices and reduced sales include Lennar (Charts), Pulte Home (Charts), Centex (Charts), D.R. Horton (Charts) and Toll Brothers (Charts). |
Sponsors
|

