Oil sinks as gasoline supplies finally riseRefineries ramp up output, demand falls and retail prices tick lower - have gasoline prices peaked?NEW YORK (CNNMoney.com) -- Oil prices sank over $1 Wednesday after a government report said supplies of gasoline, closely watched ahead of the summer driving season and running below average, rose for the first time in 13 weeks. A big jump in crude supplies also helped send U.S. light crude for June delivery 71 cents lower, to $61.55 a barrel on the New York Mercantile Exchange. Oil had traded down about 6 cents just prior to the report's release.
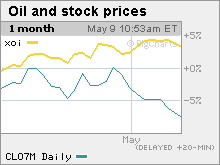
In its weekly inventory report, the Energy Information Administration said gasoline supplies rose by 400,000 barrels last week. Analysts were looking for a gain of 100,000 barrels, according to Reuters. Crude supplies swelled by 5.6 million barrels while distillates, used to make heating oil and diesel fuel, rose by 1.7 million barrels. Analysts were looking for a 900,000-barrel gain in crude stocks and a 500,000 increase in distillates. Gasoline demand, which was higher than usual most of the winter, also appeared to ease. EIA said demand over the last four weeks grew at a rate of about 1 percent. The normal rate of growth is about 1.5 percent. Refineries, closely watched due to their abnormally low rates of operation, ran at 89 percent capacity last week, up 0.7 percent from the week prior, EIA said. Analysts were looking for them to run at 89.2 percent. The combination of rising gasoline inventories, rising refinery usage and falling demand all helped send reformulated gasoline futures down nearly 2 cents a gallon to $2.187 on NYMEX. Although not directly tied to the EIA report, retail prices for gasoline also fell a penny on Wednesday and now average about $3.03 gallon, according to the motorist organization AAA. So does all this mean we've finally seen the peak in gas prices? "The jury is still out on that," Nauman Barakat, an energy trader at Macquarie Futures, the trading arm of Macquarie investment bank. Barakat noted that refineries were still operating below 90 percent capacity, and the 400,000 barrel build in gasoline stocks is relatively small. "We need to see today's builds become a more regular occurrence," he said. Refineries have suffered a series of operational setbacks over the last several months, contributing to extremely low gasoline supplies just as the nation enters the peak summer driving season. The low gasoline supplies, along with strong demand, have pushed national average retail gasoline prices over $3 a gallon. One study last weekend said the price of gasoline was at an all-time record high, not adjusted for inflation. Adjusted for inflation, the all time high is about $3.15, set in the early 1980s following the Iranian Revolution. International tensions helped keep crude prices from falling more. In Nigeria, rebels belonging to the Movement for the Emancipation of the Niger Delta (MEND) blew up three oil pipelines on Tuesday, forcing Italian firm Eni to halt production of 150,000 barrels per day, Reuters reported. Militant attacks have now shut about 28 percent of output from the world's eighth-largest exporter. "Indications from the MEND indicate that attacks may persist, reinforcing our view that oil companies won't be able to bring back most of this production in an expeditious manner within the next few months," Lehman Brothers analysts told the news agency. Although U.S. crude oil prices have fallen over the last month, shares prices for big oil companies like Exxon Mobil (Charts, Fortune 500), BP (Charts), Chevron (Charts, Fortune 500), ConocoPhillips (Charts, Fortune 500) and Royal Dutch Shell (Charts) have risen. The AMEX oil and gas index is up about 5 percent over the last 30 days. |
|


