New York housing shines - for now
How well prices hold up around New York City could go a long way toward predicting the depth of the bust.

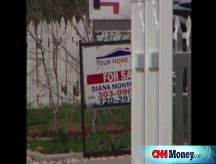
NEW YORK (Fortune) -- At a time when most housing markets continue to sour, the Big Apple remains in a relative sweet spot. Whether it can stay there may go a long way toward determining how much longer the economy remains in a funk.
Numbers released this week by Standard & Poor's show that house prices nationwide dropped 16% from a year earlier in the first half of 2008. In June, according to the latest S&P/Case-Shiller national survey of 20 metro areas, prices were below year-ago levels in every single region. Declines ranged as high as 28% in the bubble markets of Miami, Phoenix and Las Vegas.
New York, including nearby suburbs, showed a price decline of just 7%, according to Case-Shiller data. That's much better than the double-digit declines seen in other boomtowns such as Washington and Los Angeles and more in line with the drops in Atlanta and Chicago, where prices rose less during the good times. In June, New York prices even rose a bit over their May levels.
"The New York region continues to provide a substantial boost to nationwide home prices," fixed income strategist Guy LeBas wrote Tuesday in a note to clients at Philadelphia-based brokerage Janney Montgomery Scott.
New York's showing comes after a year of bad news on Wall Street, which is the region's economic growth engine.
That resilience may bring cheer to housing bulls - but only if they don't look at all the numbers. The fact is that by several measures, house prices in the New York area remain stubbornly high, suggesting much steeper declines could be in the offing.
How far prices drop in relatively healthy markets such as New York may play a big role in the recovery, or lack thereof, in the U.S. financial sector, which owns hundreds of billions of dollars of assets collateralized by houses. So far, the lion's share of mortgage-related losses have been centered in the bubble states of California, Florida, Nevada and Arizona.
But if prices drop sharply in areas such as New York that have thus far mostly been spared, lenders already sitting on more real estate than they would like could face another wave of costly foreclosures.
Just a week ago, the National Association of Homebuilders deemed metro New York the nation's least affordable market.
That New York housing is expensive is no secret. But New York's last place finish is remarkable nonetheless, making it the first metro area outside of California to take the least-affordable rap in the 17 years the NAHB has been publishing those figures.
Just 11% of area residents can afford the region's median home price of $481,000, the NAHB said. Nationally the figure is 55%. A decade ago, New York ranked in the middle of the pack in terms of affordability, with 66% of residents able to afford the median house.
The fact that the Big Apple now wears the least-affordable crown reflects the impact of the housing bubble earlier in the decade and the bust that has brought prices down sharply in places like California since 2006. Since 2000, the Case-Shiller numbers show, prices have soared 97% in Washington, 95% in Los Angeles and 94% in New York.
Those numbers jump out because over time, house prices tend to move in line with incomes. Incomes, however, have been just inching higher over the past decade - meaning that even after recent losses, house prices remain well above their long-term average in these markets. In New York, using the NAHB data, the median household income has risen just 13% since 2000.
Asha Bangalore, an economist at Northern Trust, notes that the national ratio of the median house price to median household income was fairly steady in the two decades leading up to 2000, at around 340%. But by 2005 that figure had jumped to nearly 470%, she says.
Since then, incomes have continued to rise modestly, and house prices have begun coming down. But with consumers and financial institutions now retrenching, mortgage costs are up and loans are harder to get, adding to pressure on prices.
"The housing market adjustment is incomplete and has many months to go before stabilization," writes Bangalore. Given the bloated inventories of homes for sale and the slowdown in the consumer spending that drives U.S. economic growth, she says hopes that house prices will hit their cycle low next year is "starting to look like wishful thinking."
Another measure economists use to gauge house prices is the median house price as a multiple of annual rent costs. Dean Baker, co-director of the Center for Economic and Policy Research in Washington, D.C., says rent multiples during the boom surged well above their historic levels in the mid-teens, and are slowly coming back to those ranges.
How far New York has yet to drop by that measure is sobering. Daniel Alpert, a managing director at investment bank Westwood Capital in New York, wrote in a report earlier this month that the average price-to-rent ratio in New York between 1988 and 2000 was around 12. At the 2006 regional house-price peak, however, New York's ratio was 19.
While rents have also risen in New York due to the strength, until recently, of the city's financial-sector economy, Alpert says the multiple that would bring house prices back to parity with rents is 13.5. He thus calculates that house prices in the New York area would have to drop around 18% from current levels to get back in line with historical norms.
Such a decline would likely put a big hurt on the region's economy. Mortgage-related losses and slowing consumer spending have already led to thousands of job cuts at New York mainstays such as Citi (C, Fortune 500), Merrill Lynch (MER, Fortune 500) and American Express (AXP, Fortune 500).
Baker says he expects to see further house price declines across the board, given the enormous scale of the boom earlier in the decade. But he notes an ironic bit of good news in the recent surge of inflation, which in the second quarter rose at its fastest pace in 17 years. An increase in inflation means a drop in real house prices, bringing them closer to their long-run trend. ![]()
-
 The retail giant tops the Fortune 500 for the second year in a row. Who else made the list? More
 -
 This group of companies is all about social networking to connect with their customers. More
 -
 The fight over the cholesterol medication is keeping a generic version from hitting the market. More
 -
 Bin Laden may be dead, but the terrorist group he led doesn't need his money. More
 -
 U.S. real estate might be a mess, but in other parts of the world, home prices are jumping. More
 -
 Libya's output is a fraction of global production, but it's crucial to the nation's economy. More
 -
 Once rates start to rise, things could get ugly fast for our neighbors to the north. More


