Credit markets remain tight
Lending remains squeezed as investors look for guidance as to what Washington will do next.

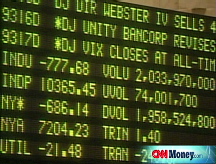
 |
| Click on the chart to see other bond prices. |
NEW YORK (CNNMoney.com) -- Credit markets remained in a holding pattern Tuesday, as investors waited to for Washington's response to the House's rejection of a massive financial bailout plan.
Prices for long-term bonds were sharply lower as investors returned to stocks. The Dow rallied more than 300 points Tuesday, a day after plunging more than 777 points in its biggest single-day point-loss ever.
The government's rejected $700 billion rescue plan was meant to give stalled credit markets a jolt of liquidity by absorbing bad assets from troubled financial institutions. Now that the shock of the initial bill's rejection has worn off, investors remain somewhat confident some type of reformulated plan will pass.
"They have to look at the consensus coming from Main Street," said William Larkin, portfolio manager at Cabot Money Management. Lawmakers need to "sweeten the deal" and "do a better job explaining what they are doing" so that taxpayers feel they have some incentive to back a plan that they are largely funding, said Larkin.
But with no firm plan in place, lending between banks and to consumers on Tuesday remained limited and expensive. When banks don't lend freely to each other and the credit system gets backed up, consumers and businesses have a hard time obtaining loans.
"Banks are hesitant to lend to each other because they are feeling that they need to sit on as much as cash as possible," said Steve Van Order, chief fixed income strategist at Calvert Funds. Credit lines are so tight that companies are already working on locking in financing for the end of the year, he added. The impending close of the quarter and the calendar year have exacerbated the credit crunch.
With so much uncertainty swirling around, "it is impossible to evaluate risk," added Larkin.
In addition, banks are seeing their credit choked off because money market funds, which have traditionally provided funds to banks by buying corporate commercial paper, are instead buying short-term Treasury bills, according to Van Order. Treasury bills are considered both safe and liquid, and money market funds are acting more cautiously than usual.
As the flow of credit has seized up between banks, the Federal Reserve has tried to pump liquidity into the system. "The central bank is continuing to make concerted efforts on a scale we have never seen before to try to control the liquidity of the markets," said Van Order, but "the money is not getting further downstream."
"The Fed is only able to pump money so far and then it reaches choke points," said Van Order.
While a bailout plan will help unfreeze credit markets, it may not be enough. "The cheap capital is gone," said Larkin.
Other countries are having liquidity problems as well, which "is why the Central Bank has a currency swap with nine Central Banks right now," said Van Order.
Market measures: Two market indicators showed the price of borrowing for banks remaining high - a sign that banks are nervous about lending to other banks. These indicators are "at levels that indicate the money markets are still locked up," said Van Order.
One gauge, the "TED spread," showed high prices of loans between banks. The TED spread measures the difference between three-month Libor and the three-month Treasury borrowing rates and is a key indicator of risk. The higher the spread, the bigger the aversion to risk. On Tuesday, the spread retreated to 3.04%, after surging to 3.53% - its highest level in more than 25 years.
On Sept. 5, the TED spread was only 1.04%.
Furthermore, the difference between the Libor and the Overnight Index Swaps rose to a fresh record high 2.46% from 2.20% Monday, according to data reported by Bloomberg.com. The Libor-OIS "spread" measures how much cash is available for lending between banks, and is used by banks to determine lending rates. The bigger the spread, the less cash is available for lending.
The Libor, or the London interbank offered rate, is a daily average of what banks charge other banks to lend money in London. Larkin compared the Libor "the dial on the engine of the car," showing how much power the economy has. "And right now it is indicating that the car is severely overheating."
The 3-month Libor rate, at 4.05% Tuesday, has been trending higher for some time as the European economy has stalled. The rate has stayed above 3% consistently during the past month - a level not seen since the start of this year.
The overnight Libor rate jumped to an all-time high of 6.88%, according to the British Banking Association, which has been keeping records since 1984.
The European economy saw continued signs of weakness Tuesday. After a plunge in the value of Irish bank stocks, the Dublin government announced it would guarantee all deposits in Irish banks.
In addition, the Belgian bank Dexia had to be rescued by the government, and the Russian stock markets had to suspend trading after suffering heavy losses early in their session.
Treasurys: Government debt prices eased Tuesday from the surge in the wake of the House rejection of the bailout proposal. According to Van Order, a small rebound following such a large move one day earlier was not surprising.
In addition, although markets were mostly shocked that the bailout bill did not pass the House Monday, "people think that it is not dead, just delayed," said Van Order. Lawmakers "are going to have to put something together."
Larkin echoed the sentiment. "People are now assuming that later in the week they will have some kind of a solution" for the economy, he said.
The benchmark 10-year note fell 1 20/32 to 101 27/32 and its yield ticked up to 3.78% from 3.62% late Monday. Bond prices and yields move in opposite directions.
The 30-year bond fell 2 10/32 to 104 8/32 and its yield rose to 4.25% from 4.15%.
The 2-year note fell 17/32 to 100 4/32 and its yield rose to 1.95% from 1.71%.
The yield on the 3-month bill jumped to 1.04% from 0.39%. The 3-month note is a popular asset for money markets looking for stability because it offers a safe place to park cash on a short-term basis. ![]()


