Search News

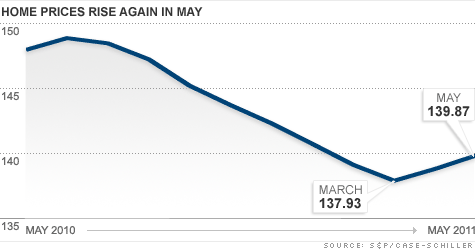
NEW YORK (CNNMoney) -- May home prices in 20 major cities dipped 4.5% from one year ago, marking a continued decline in the already battered housing market.
The S&P/Case-Shiller report posted declines in both its 20-city composite and its 10-city index, which declined 3.6% year-over-year.
But housing did show some signs of life in May. Home prices ticked higher for the second consecutive month following an eight-month slide.
In May the 20-city index gained 1% compared with a month earlier, while the 10-city index rose 1.1% month-over-month.
David Blitzer, a spokesman for S&P, was cautious in detailing the index gains.
"While the monthly data were encouraging, most [metro areas] and both composites fared poorly in annual terms," he said.
Prices are also still off more than 32% from their highs, set in July, 2006 and hover at about the same level they were in mid-2003.
According to Mike Larson, a housing market analyst for Weiss Research, the market is going nowhere fast.
"I like to picture it as a sailing ship caught in the doldrums," he said. "You're no longer being swept away by a hurricane but you're not moving much either."
Blitzer attributed much of the home price increase for May to seasonal effects. Spring is the hottest time of year for home buying and the added demand usually drives prices higher.
Taking those seasonal factors into account, the 20-city index was flat and the 10-city showed a gain of just 0.1%.
Sixteen metro areas recorded non-seasonally adjusted month-over-month gains in May. The biggest winner was Boston, where prices jumped 2.7%, followed by Minneapolis at 2.6% and Washington at 2.4%. The nation's capital was the only place to record a gain over the past 12 months, up 1.3%.
Three cities declined month-over-month, led by Detroit with a 2.8% drop, Las Vegas, with a 0.9% decline, and Tampa, where prices fell 0.6%. The biggest loser over the past 12 months was Minneapolis, where prices fell 11.7%.
The positive aspects of the report has caused Robert Shiller, the Yale economist who, with his colleague, Karl Case, devised the index, to soften -- a little -- what had been an alarmingly pessimistic prediction for the housing market.
He had warned back in February that home prices could drop another 10% to 25% over the next few years.
"The recent data lowers the probability of that scenario a little bit, but I still worry about it," he said.
His colleague, Karl Case, was more positive.
"There is a big difference between bouncing along a downward drift and bouncing along a rocky bottom," he said. "The fact that prices in a repeat sales index and using a three month moving average actually went up, seems to me, says something important."
Case, however, also mentioned several negative factors having impact on the housing market right now or that will in the near future.
"First, it is difficult for home buyers to qualify for a mortgage," he said.. "Second, Fannie Mae and Freddie Mac will lower the size of conforming mortgages on Oct. 1. Finally, consumer sentiment is still poor."
Shiller also brought up the weak labor market. An unemployment rate of 9.2% in June acts as a strong headwind for housing. ![]()
| Overnight Avg Rate | Latest | Change | Last Week |
|---|---|---|---|
| 30 yr fixed | 3.80% | 3.88% | |
| 15 yr fixed | 3.20% | 3.23% | |
| 5/1 ARM | 3.84% | 3.88% | |
| 30 yr refi | 3.82% | 3.93% | |
| 15 yr refi | 3.20% | 3.23% |
Today's featured rates: