Search News

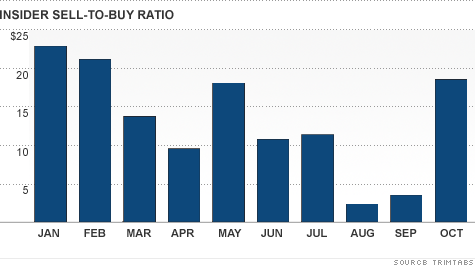
There were almost $19 worth of insider stock sales in October for every $1 of insider buys, according to market research firm TrimTabs. That was the most aggressive pace since February.
NEW YORK (CNNMoney) -- Stocks may have put up their best performance in years last month, and it looks like company insiders decided to cash in.
Insider selling accelerated in October to the most aggressive pace since February. That follows the S&P 500's gain of 11% -- its best monthly performance in almost 20 years.
In fact, there were almost $19 worth of insider stock sales in October for every $1 of insider buys, according to market research firm TrimTabs.
That was way up from near record low levels of insider selling -- between $2 and $4 of sales for every $1 of insider buying -- in August and September.
During the last week in October, insider trading was concentrated in consumer discretionary and technology sectors, according to Ben Silverman at InsiderScore, which tracks transactions by corporate officers and directors, which were among the market's stronger performers.
In fact, company insiders at chip companies Intel (INTC, Fortune 500) and SanDisk (SNDK, Fortune 500) and car dealer chain AutoNation (AN, Fortune 500) sold shares in October, when all three stocks were trading near their 52-week highs.
While corporate officers and directors have a number of reasons for selling their shares of their own company, including exercising their options, a swift pick up in selling can be a cause for concern.
"Insider buying is a much stronger signal, because people buy stock for one main reason: they think it's going to go up," said Lawrence Creatura, portfolio manager at Federated Investors. "But an acceleration in insider selling is an indication that executives feel that some of the easier, near-term gains are behind them."
Creatura, who manages the Federated Clover Small Value Fund (VSFIX), typically monitors insider buying and selling changes on an individual stock basis and looks for conspicuous activity.
"You have to consider how long an executive has been at the company, what title they hold, the size of their holdings, and whether their transaction is related to options," Creatura said.
Still, it's often not a good omen for the future when insiders are selling.
Historically, when company executives sell their shares, the stock tends to underperform the market by more than 5% over the next year, writes University of Michigan professor Nejat Seyhun in his book Investment Intelligence from Insider Trading.
Meanwhile, stocks purchased by company insiders typically outperform the market by almost 9% over the following 12 months, he said.
The fact that insiders would take advantage of the October rally may not be a huge surprise. Although shares surged last month, that followed five straight months where all the major indexes finished lower.
Many investors are still skeptical about whether the worst is over in Europe. The sluggish U.S. economy is giving investors pause as well. That may be playing a role in some of the recent insider sales.
"Economic growth has been moderating, and the Federal Reserve has been marking down its estimates. And companies are also growing more conservative about their earnings over the next year. It doesn't bode well for the market," said Daniel Morris, portfolio manager of the Manor Growth Fund (MNRGX). ![]()
| Index | Last | Change | % Change |
|---|---|---|---|
| Dow | 32,627.97 | -234.33 | -0.71% |
| Nasdaq | 13,215.24 | 99.07 | 0.76% |
| S&P 500 | 3,913.10 | -2.36 | -0.06% |
| Treasuries | 1.73 | 0.00 | 0.12% |
| Company | Price | Change | % Change |
|---|---|---|---|
| Ford Motor Co | 8.29 | 0.05 | 0.61% |
| Advanced Micro Devic... | 54.59 | 0.70 | 1.30% |
| Cisco Systems Inc | 47.49 | -2.44 | -4.89% |
| General Electric Co | 13.00 | -0.16 | -1.22% |
| Kraft Heinz Co | 27.84 | -2.20 | -7.32% |
| Overnight Avg Rate | Latest | Change | Last Week |
|---|---|---|---|
| 30 yr fixed | 3.80% | 3.88% | |
| 15 yr fixed | 3.20% | 3.23% | |
| 5/1 ARM | 3.84% | 3.88% | |
| 30 yr refi | 3.82% | 3.93% | |
| 15 yr refi | 3.20% | 3.23% |
Today's featured rates: