Click the chart for more oil and commodities data
NEW YORK (CNNMoney) -- Oil prices fell Thursday, hitting an eight-month low, as markets continued to react to disappointing economic news across the globe.
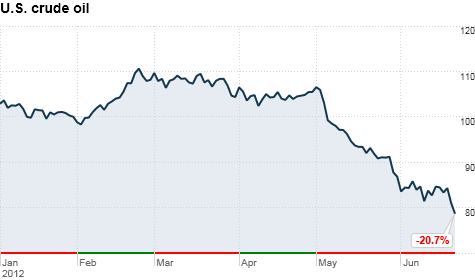
The price of oil for August delivery fell to $78.58 a barrel as markets settled, down nearly 4% from Wednesday. This is the first time since October that oil prices hit below $80, what analysts consider a key psychological number.
Signs of a slowdown in manufacturing in China, Europe and the United States delivered the oil market another blow on Thursday.
"Prices have gotten clobbered, and it's being driven by the deteriorating economic data," said Matt Smith, a commodity analyst at Summit Energy Services.
A survey of Chinese manufacturers saw a decline in the number of export orders, while the manufacturing index in Europe remained at a three-year low. Domestically, the Philadelphia Federal Reserve reported a 16.6% drop in its regional manufacturing index.
The oil markets also reacted to jobless claims, which analysts said showed little improvement. Prices were also still coming down from disappointment over the Federal Reserve's decision to hold interest rates steady.
The sharp dive in prices over the last month and a half has analysts concerned. Crude oil prices are often indicative of what's going on in the larger global economy.
"This is a tempering of optimism and expectations in economic growth beyond the oil market," Smith said.
But the low prices aren't just a reflection of large-scale issues in the world economy. A North American success story may share in the blame, according to Tom Kloza, chief oil analyst of the Oil Price Information Service.
"You have a lot of U.S. crude that's coming on line at a much faster rate than anyone anticipated and it's displacing some of the foreign sweet crude that would come in under normal circumstances," he said.
Gasoline prices fall in tandem: Kloza, whose firm compiles the gasoline pump price averages for AAA, said that the price of gasoline has also reacted to these pressures.
Gas prices fell below to $3.472 per gallon on Thursday, below $3.50 for the third day in a row after more than four months above that mark, according to AAA.
Kloza anticipates that gas prices will continue to fall as the summer driving season heats up, and well into the fall.
"The market is telling you that right around Election Day, the average price is going to be below $3 a gallon," he said. "Refiners will continue to have incentives to run at high rates because of cheaper crude oil available in the U.S., and demand will continue to be down."
Oil prices seen bottoming out soon: It's not unusual for oil prices to drop in the summer, according to Dan Dicker, an oil trader and author of "Oil's Endless Bid: Taming the Unreliable Price of Oil to Secure Our Economy."
"The steady decline in oil prices isn't unusual for this time of year. June is a weak month for oil prices," he said. "Now, you're adding that to negative growth, and that's having an impact."
But despite the forces working against the market, analysts don't expect oil prices to go much lower.
"We're going to stay in the 70s, whether that's $71 or $79," said Kloza. "Unless we have a Lehman-like event that throws a wrench in it, we'll bottom out in the next 10 to 15 business days." ![]()
| Index | Last | Change | % Change |
|---|---|---|---|
| Dow | 32,627.97 | -234.33 | -0.71% |
| Nasdaq | 13,215.24 | 99.07 | 0.76% |
| S&P 500 | 3,913.10 | -2.36 | -0.06% |
| Treasuries | 1.73 | 0.00 | 0.12% |
| Company | Price | Change | % Change |
|---|---|---|---|
| Ford Motor Co | 8.29 | 0.05 | 0.61% |
| Advanced Micro Devic... | 54.59 | 0.70 | 1.30% |
| Cisco Systems Inc | 47.49 | -2.44 | -4.89% |
| General Electric Co | 13.00 | -0.16 | -1.22% |
| Kraft Heinz Co | 27.84 | -2.20 | -7.32% |
| Overnight Avg Rate | Latest | Change | Last Week |
|---|---|---|---|
| 30 yr fixed | 3.80% | 3.88% | |
| 15 yr fixed | 3.20% | 3.23% | |
| 5/1 ARM | 3.84% | 3.88% | |
| 30 yr refi | 3.82% | 3.93% | |
| 15 yr refi | 3.20% | 3.23% |
Today's featured rates:


